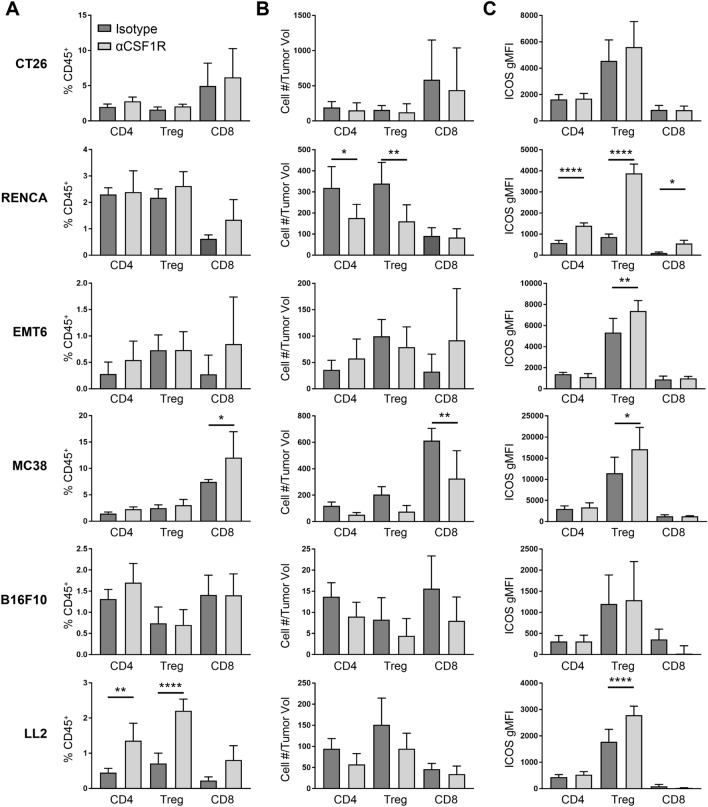
Fig. 2.
αCSF1R treatment has varying effects on T cell density and activation across different tumor models. a–c Flow cytometry analysis of tumors from αCSF1R- or isotype control-treated animals. T cells were subdivided into CD4+Foxp3− (CD4), CD4+Foxp3+ (Treg), or CD8+ (CD8) subsets and are shown as percentage of CD45+ immune cells (a) or number of cells normalized to individual tumor volume (mm3) at the end of study (b). c Geometric mean fluorescence intensity (gMFI) for ICOS staining on different T cell populations; n = 5–10 animals/group. One-way ANOVA, Tukey’s multiple comparisons. *p < 0.05; **p < 0.01; ****p < 0.0001

