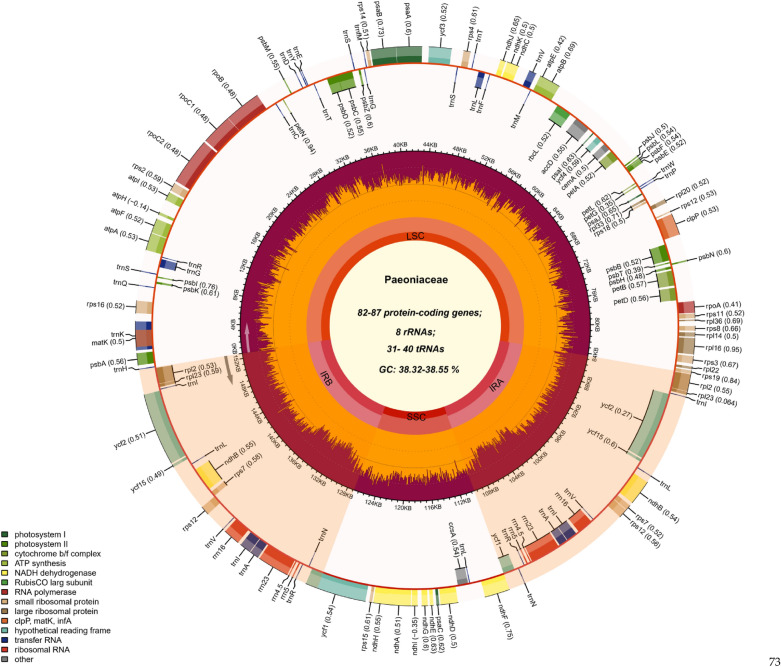
Figure 1.
Chloroplast genome map of Paeoniaceae species, using P. intermedia as the template. The gradient GC content of the genome was plotted in the second circle with zero level based on the outer circle. The gene names and their codon usage bias were labeled on the outermost layer. The gene specific GC content was depicted with the proportion of shaded areas. Represented with arrows, the transcription directions for the inner and outer genes were listed clockwise and anticlockwise, respectively.

