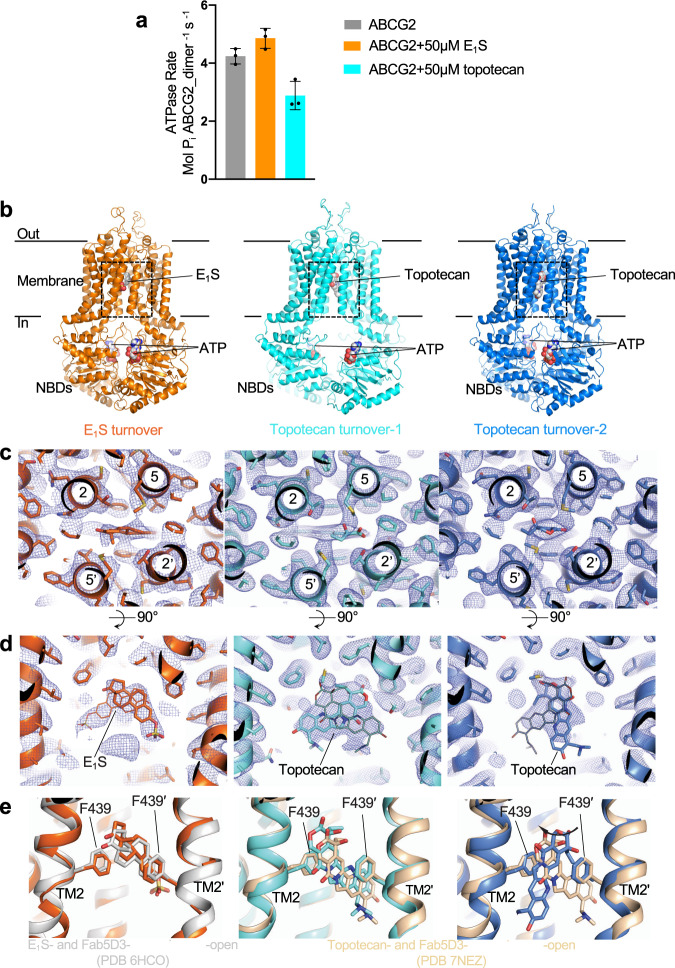
Fig. 1. Structures of ABCG2 under turnover conditions.
a ATPase activity of nanodiscs-reconstituted wild-type ABCG2 in the presence and absence of 50 μM E1S or 50 μM topotecan. The bars show means rate. The experiment was performed three times independently with the same batch of nanodiscs (n = 3); error bars depict standard deviations (s.d.) Source data are provided as a Source Data file. b Ribbon diagrams of turnover structures. E1S turnover is shown in orange, topotecan turnover-1 is shown in light cyan and topotecan turnover-2 is shown in blue. The coloring of the three structures is maintained throughout the figures and panels. Bound ATP, E1S, and topotecan are shown in sphere representation and labeled. c Close-up view of substrate-binding pockets between the TMDs viewed from the extracellular side. TM helices are shown as ribbons and labeled, residues and bound substrates are shown as sticks. Substrates are at center of the panels. Non-symmetrized EM density maps are shown as blue mesh. d Similar to c, but viewed from within the membrane. Bound substrates are labeled. Two possible orientations of bound substrates are shown for each density as thin or thick sticks, respectively. e Superposition of turnover states with structures of substrate-bound inward-open ABCG2 bound to 5D3-Fab fragments using the side chains of F439s as anchors. Left, E1S-bound ABCG2 structure (PDB 6HCO) is shown in gray cartoon. Middle and right, topotecan-bound ABCG2 structure (PDB 7NEZ) is shown in yellow cartoon. The substrates and side chains of F439 residues are shown as sticks.

