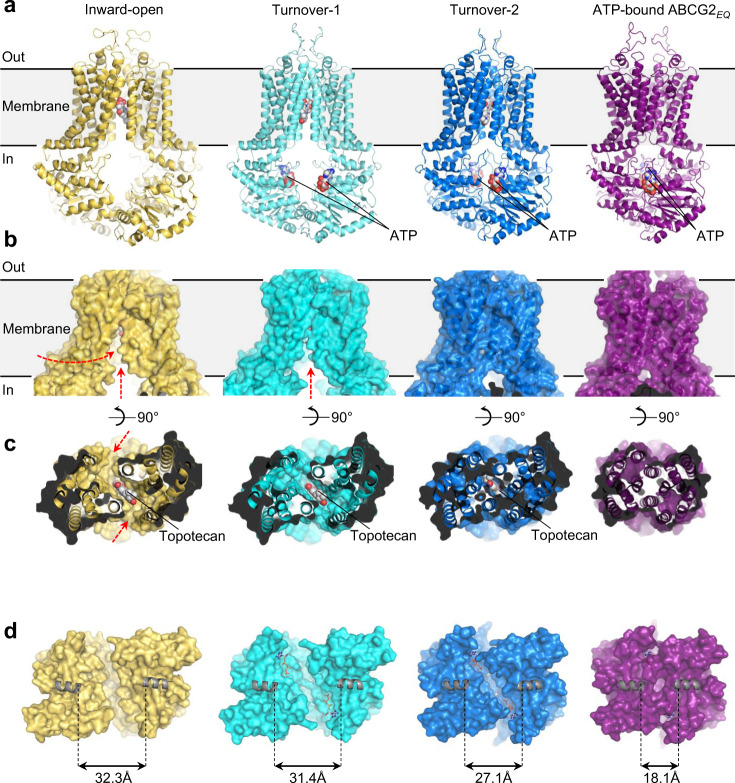
Fig. 2. Coupled NBD and TMD closing.
Structures of four states are shown: “Inward-open” depicts topotecan- and 5D3-Fab- bound ABCG2 (PDB ID 7NEZ, colored in yellow), the turnover states are from this study, “ATP-bound ABCG2E211Q” depicts the closed conformation (PDB ID: 6HBU, colored in purple). a Ribbon diagrams with substrates and ATP shown as spheres. b Surface representations of ABCG2, emphasizing the distinct TMD conformations. Red arrows depict openings to cavity 1 from within the lipid bilayer or from the cytosol. c View of substrate-binding site in cavity 1 of ABCG2. The TMDs are shown in ribbon and surface representation and viewed from the cytoplasmic side of the membrane. Substrates are shown as spheres and labeled. Red arrows depict openings to cavity 1 from within the lipid bilayer. d Surface representations of the NBDs viewed from the membrane. Bound ATP is shown as sticks. The coupling helices (CpHs) are shown as gray cartoons. Distances between CpHs are indicated.

