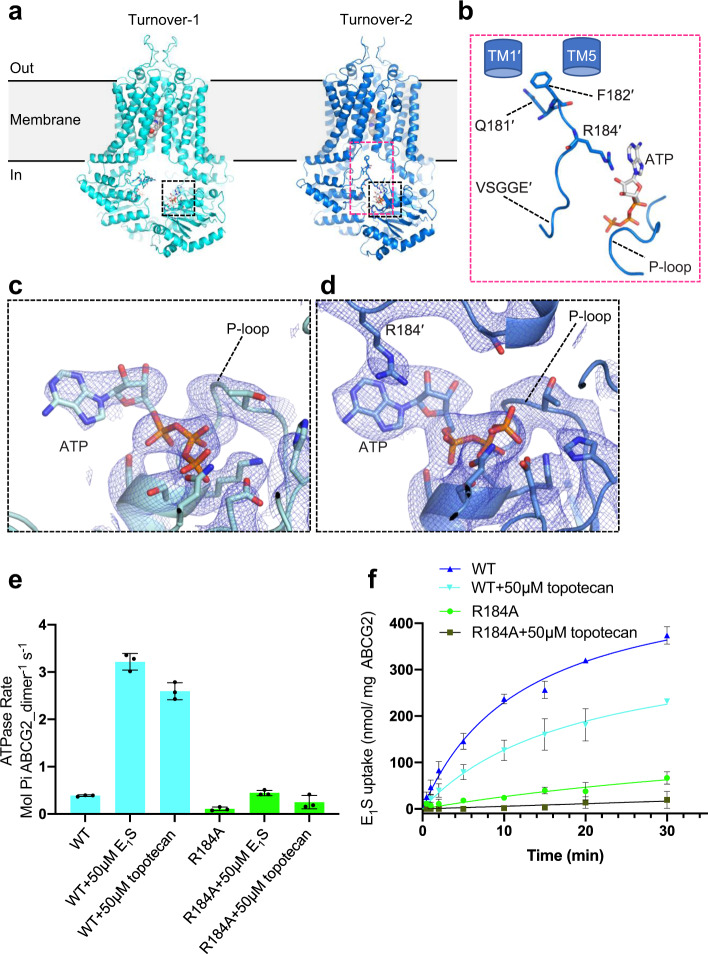
Fig. 3. Domain interfaces and the role of R184.
a Ribbon diagrams of topotecan-bound turnover states. ATP is shown as sticks, topotecan is shown as spheres. Dashed black and red boxes show domain interfaces with close-up views in b–d. b Close-up view of domain interface in turnover-2 conformation. TM1’ and TM5 are schematically shown as blue cylinders. P-loop, X-loop, and signature motif (VSGGE) are shown in cartoon mode. ATP and key side chains involved in surface interactions are shown as sticks. c and d Close-up views of ATP-binding sites of turnover-1 and turnover-2 states, as indicated in a. ABCG2 is shown as a ribbon diagram, key residues and bound ATP are shown as sticks and labeled. Non-symmetrized EM density maps are shown as blue mesh. e ATPase activity of liposome-reconstituted wild-type and mutant ABCG2 (R184A) in the presence and absence of 50 μM E1S or 50 μM topotecan. Data are presented as mean rates ± s.d. The experiment was performed 3 times independently with the same batch of liposomes (n = 3). Error bars depict s.d. f ABCG2-catalyzed E1S transport into proteoliposomes by wild-type ABCG2 or R184A variant in the presence or absence of 50 μM topotecan. Data are presented as mean values ± s.d. The experiment was performed 3 times independently with the same batch of liposomes (n = 3). Error bars depict s.d. Source data are provided as a Source Data file.

