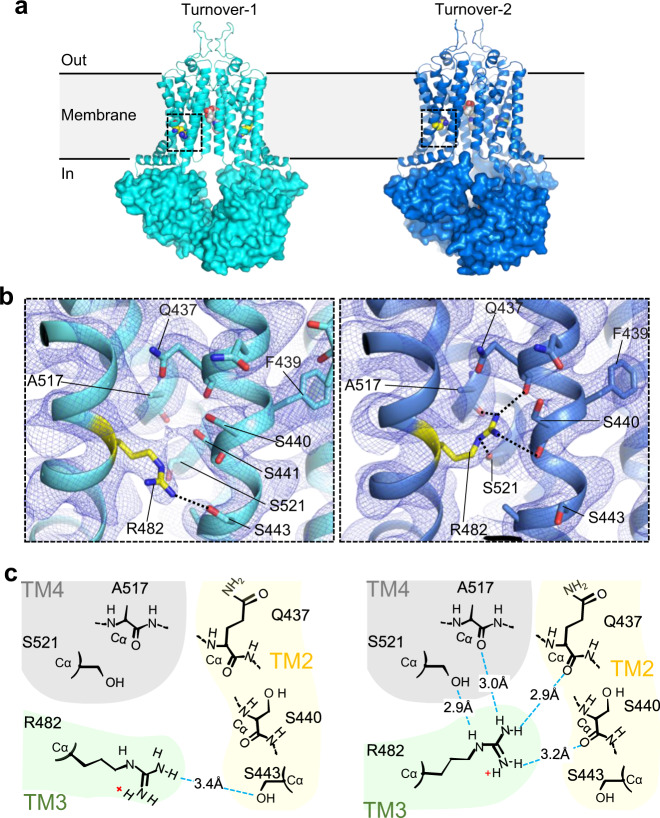
Fig. 4. Conformational change of R482 in turnover states.
a Ribbon diagrams of topotecan-bound turnover states, with NBDs shown as surfaces. Bound topotecan and the side chain of R482 are shown as spheres. Dashed black boxes show regions around R482. b Closeup views of TMD regions indicated in a. ABCG2 is shown as a ribbon diagram in turnover-1 (left) and turnover-2 (right) states. R482 and surrounding residues are shown as sticks and labeled. Non-symmetrized EM density is shown as blue mesh. Hydrogen bonds are indicated as black dashed lines. c Schematic diagram of hydrogen bonds formed by R482 in turnover-1 (left) and turnover-2 (right). H-bonds are shown as blue dashed lines. Yellow shading highlights residues of TM2, green shading highlights residues of TM3, gray shading highlights residues of TM4.

