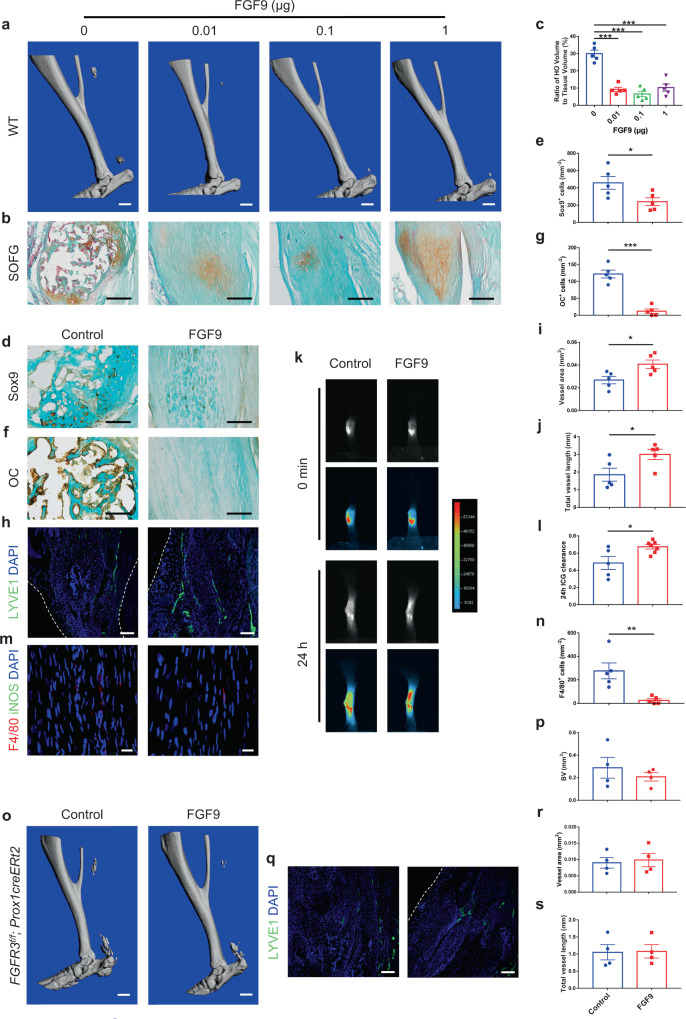
Fig. 6. Local application of FGF9 inhibits acquired HO formation via activating FGFR3 in LECs.
a–c Representative μCT (a) and SOFG staining (b) images of heterotopic bone in the Achilles tendon of WT mice treated with 0 (control), 0.01, 0.1, or 1 μg FGF9 in Matrigel at 8 weeks after surgery and histomorphometry analysis (c). n = 5 per group. Scale bars, 1 mm for μCT; 200 μm for SOFG. d–g Representative Sox9 (d) and OC (f) IHC images of heterotopic bone in the Achilles tendon of WT mice treated with 0 (control) or 0.1 μg FGF9 in Matrigel at 8 weeks after surgery and relative quantification (e, g). n = 5 per group. Scale bars, 100 μm. h–j Representative confocal images of LYVE1 (green) and DAPI (blue) immunostained Achilles tendon sections (h) and lymphatic quantitative analysis (i, j). n = 5 per group. Scale bars, 100 μm. k, l Representative ICG-NIR images (k) of footpads immediately (0 min, top) and 24 h (bottom) after ICG administration in WT mice treated with FGF9 (n = 7) relative to controls (n = 5) at 8 weeks after tenotomy and 24 h ICG clearance (l). m, n Representative confocal images of Achilles tendon sections immunostained with F4/80 (red), iNOS (green), and DAPI (blue) (m) and relative quantitative analysis (n). Scale bars, 20 μm. o, p Representative μCT images (o) of heterotopic bone in the Achilles tendon of FGFR3Prox1 mice treated with FGF9 relative to controls at 8 weeks after surgery and quantitative analysis (p). n = 4 per group. Scale bars, 1 mm. q–s Representative confocal images of LYVE1 (green) and DAPI (blue) immunostained Achilles tendon sections (q) and lymphatic quantitative analysis (r, s). n = 4 per group. Scale bars, 100 μm. White dashed lines indicate outlines of the tendon (h, q). All data represent mean ± SEM. *P < 0.05; **P < 0.01; ***P < 0.001 by unpaired two-tailed Student’s t-test (e, g, i, j, l, n, p, r, s) or by one-way ANOVA followed by a Tukey’s multiple comparisons test (c).

