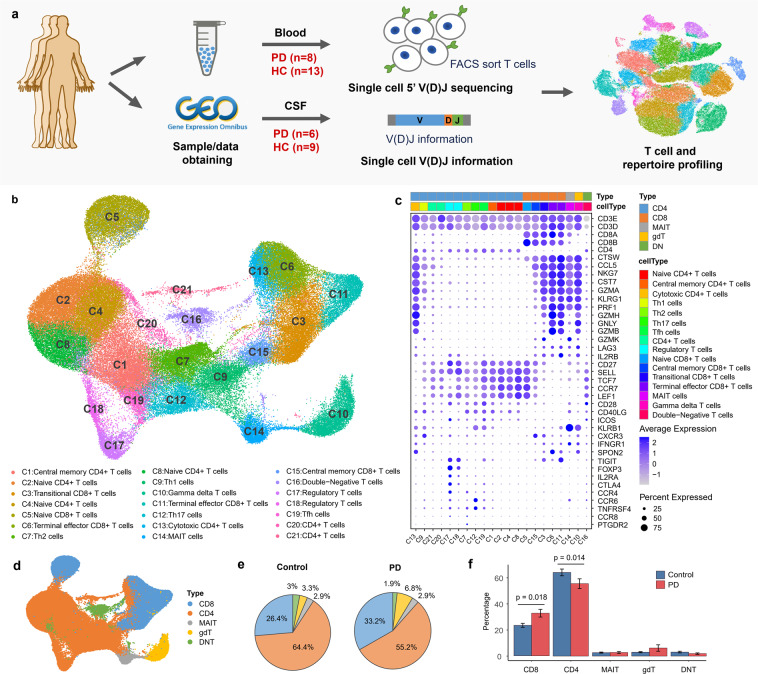
Fig. 1. Single-cell transcriptome profiling of T cells.
a Overview of experimental design. CD3+ T cells from the blood of 8 PD patients and 6 healthy controls were sorted by FACS and simultaneously subject to single-cell transcriptome and immune sequencing with 5’ V(D)J capture. Single-cell TCR data from cerebrospinal fluid were downloaded from GEO with accession ID GSE134578. Batch effect correction and unsupervised clustering were performed after merging single-cell datasets. b UMAP projection of 103,365 single T cells, showing 21 clusters. Each dot corresponds to one cell and is colored according to cell cluster. c Dot plot shows the expression of marker genes for 21 cell clusters. The size of the dot corresponds to the percentage of cells expressing the gene in each cluster, and the color represents the average log normalized gene expression. Markers were ordered to visualize the differences between cell types. d UMAP projection of T cells colored by the 5 major T cell types, including CD8+ T cells (CD8), CD4+ T cells (CD4), mucosal-associated invariant T cells (MAIT), gamma delta T cells (gdT) and double-negative T cells (DNT). e Pie charts showing the percentages of the five major T cell types in the blood of PD patients and healthy controls. For each cell type, the percentage was obtained by dividing the number of cells in that cell type by the total number of cells in all PD patients or in all healthy controls. f Barplot showing the percentages for different T cell types identified from single cell analysis. Error bars represent standard error of the mean.

