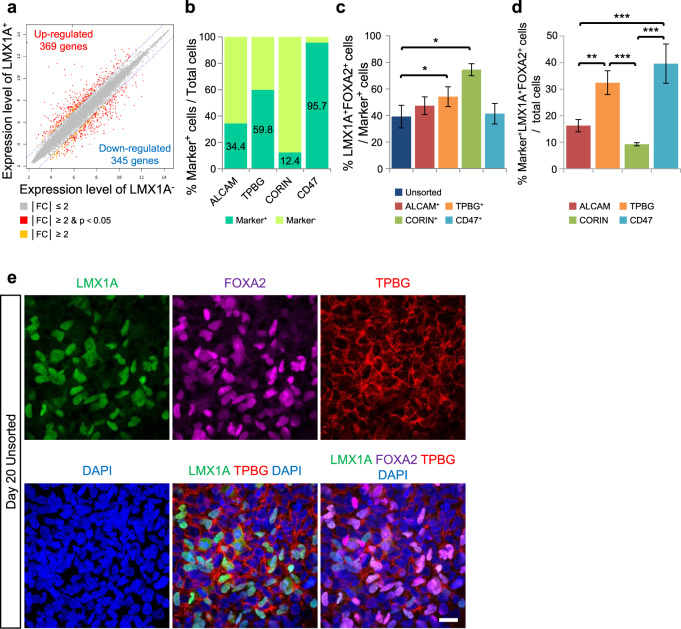
Fig. 2. Identification of TPBG as a novel marker for sorting vmDA precursors from hESCs.
a Comparison of gene expression profiles between eGFP+ (LMX1A+) and eGFP− (LMX1A−) cells among vmDA precursors on D20. b The ratio of separated cells via MACS targeted for each marker (ALCAM, TPBG, CORIN, and CD47) on D20 with three biological replicates. c Flow cytometry analysis of LMX1A+ and FOXA2+ cells in unsorted, ALCAM+, TPBG+, and CD47+ populations on D20 with five biological replicates. *p < 0.05, one-way ANOVA with Bonferroni’s multiple-comparison tests. d Quantification of LMX1A+FOXA2+Marker+ triple-positive cells from the total population of differentiated cells on D20 with three independent experiments. **p < 0.01, ***p < 0.001, one-way ANOVA with Bonferroni’s multiple-comparison tests. e Representative fluorescent images for the expression of LMX1A (green), FOXA2 (magenta), and TPBG (red) in vmDA precursors on D20. DAPI (blue) was used as a counterstain. Scale bar, 25 μm.

