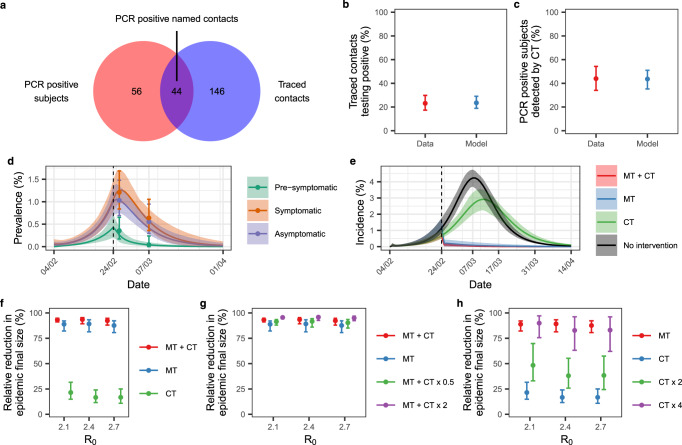
Fig. 6. Impact of contract tracing on the epidemic dynamics.
a PCR-positive subjects identified by mass testing (red) in comparison to all subjects contacted by contact tracing (blue) and the positive traced individuals (intersection). b Observed (red, mean 95% exact binomial CI) and estimated (blue, mean and 95% CrI) proportion of traced contacts testing positive by PCR (c) and proportion of PCR positive subjects detected by contact tracing. d Observed and estimated SARS-CoV-2 prevalence. The points represent the observed prevalence data, with the 95% exact binomial CI. The solid lines represent the mean, and the shading represents the 95% credible interval. e Simulated incidence of SARS-CoV-2 infection assuming the following interventions: mass testing, lockdown, and contact tracing (MT + CT, red); mass testing and lockdown (MT, blue); contact tracing (CT, green). The unmitigated (no intervention) epidemic is shown in black. The dark lines represent the mean, shading represents the 95% credible interval. In d and e, the vertical dashed line represents the time interventions were implemented. f Relative reduction in the epidemic final size compared to the unmitigated epidemic obtained assuming the same interventions of e. g Relative reduction in the epidemic final size compared to the unmitigated epidemic obtained assuming the implementation of mass testing, lockdown and contact tracing (MT + CT, red), mass testing and lockdown (MT, blue), mass testing, lockdown and half the estimated rate of contact tracing (MT + CT x 0.5) and mass testing, lockdown and double the estimated rate of contact tracing (MT + CT x 2). g Relative reduction in the epidemic final size compared to the unmitigated epidemic obtained assuming the implementation of mass testing and lockdown (MT), contact tracing (CT), contact tracing with double the estimated tracing rates (CT x 2) and contact tracing with four times the estimated tracing rates (CT x 4). In f, g, and h points represent the mean and bars the 95% CrI. All estimates were obtained using 100 samples from the posterior distribution of the parameters. b–e show the results obtained with R0 = 2.4.

