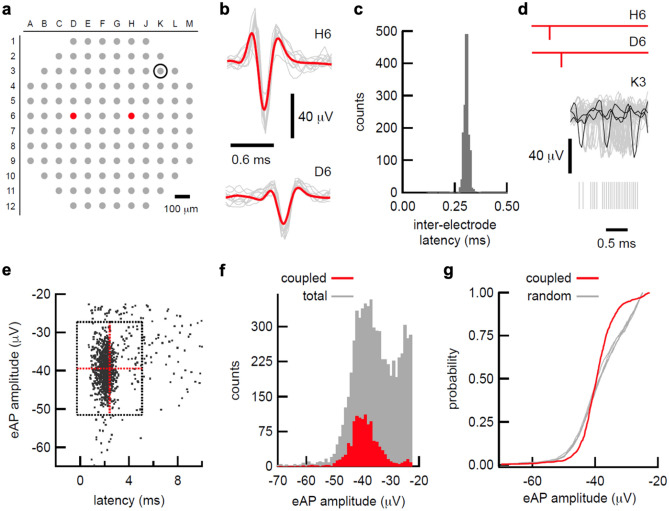
Figure 1.
Propagation signals are a clock used to identify coupled eAP’s. (a) Map of electrode array used in these experiments. Two electrodes that detect single axon eAP propagation are shown in red. Electrode K3 is the location of the spike cloud that follows the propagation signal. (b) The eAP waveforms at H6 and D6 are shown. Individual eAPs are in grey; the average of 100 eAP waveforms is superimposed in red. (c) The distribution of inter-electrode eAP latency between H6 and D6. The high number of co-occurrences (n = 1360) and low coefficient of variation (0.078) are consistent with action potential propagation. (d) aligning the eAP co-occurrences at H6 and D6 (schematized in red) reveals a cloud of eAPs at K3. Twenty eAP waveforms from K3 are superimposed in grey, with 3 waveforms highlighted in black. The timing of 50 eAPs from K3 following the H6/D6 co-occurrence are shown as grey hash marks beneath eAP the waveforms. (e) the plot of eAP amplitude at versus time after H6/D6 co-occurrence shows a large cluster. All eAPs that occurred between 0.5 and 10 ms after the H6/D6 co-occurrence are displayed. Red lines indicate the mean latency and eAP amplitude, respectively. Horizontal and vertical grey lines indicate two standard deviations of the mean for each dimension. (f) the amplitude distribution of the spikes in K3 that occurred within 0.5 to 10 ms following the H6/D6 co-occurrence (red bars) are superimposed on the all-points spike amplitude distribution histograms from electrode K3. (g) cumulative distribution of the coupled spikes in K3 (red line) superimposed on the cumulative distributions from 5 randomly selected groups of amplitudes from the all-points distribution from K3, showing that the amplitudes of the coupled eAPs were not randomly selected from the full amplitude distribution.

