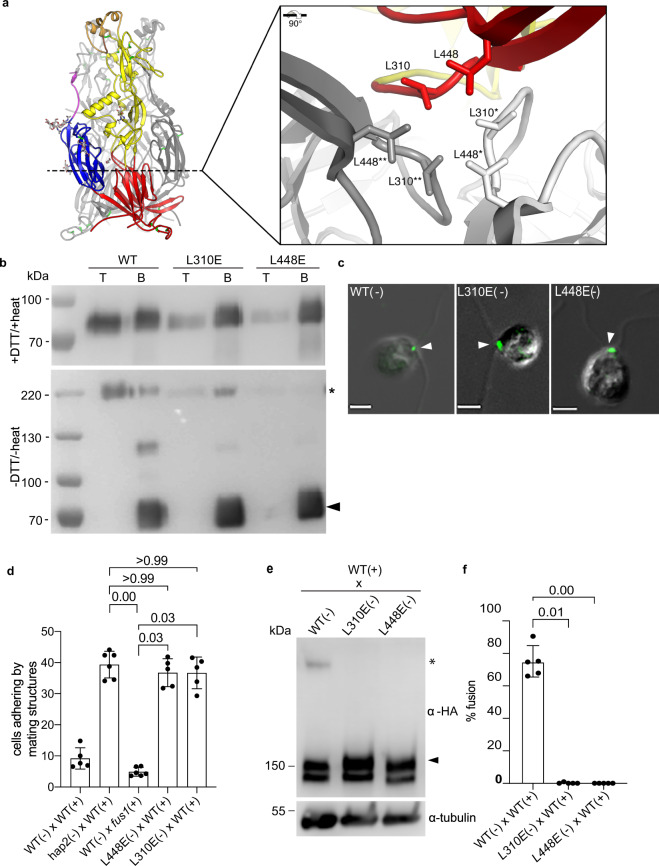
Fig. 2. Mutations at the trimer interface prevent HAP2 trimer formation in vitro and in vivo, and block gamete fusion.
a HAP2 trimer structure (PDB: 6E18) showing the locations of leucines 310 and 448 by the dotted line. The inset (right panel) shows a detailed view of the residues on each of the three monomers (colored red, gray, and white). b Immunoblots of the top (T) and bottom (B) fractions from a liposome OptiprepTM co-floatation assay indicating that trimer formation was severely impaired in HAP2e-L310E and HAP2e-L448E mutants compared to WT. For the upper immunoblot, samples were prepared with 20 mM DTT and heating at 95 °C for 10 min. For the lower immunoblot, samples were prepared without heating and reducing agent. Results are representative of 5 independent experiments. c Indirect immunofluorescence with an anti-HA antibody showing that HAP2-HA-L310E and HAP2-HA-L448E were localized between the two cilia at the site of the minus mating structure, similarly to WT (arrowheads). Scale bars, 5 m. Images are representative of at least 100 cells examined for each strain. d Mating structure adhesion of both L448E and L310E minus gametes with WT plus gametes was indistinguishable from that of the hap2 mutant. Percentages of paired cells were determined at 10 min after mixing. fus1 plus gametes mixed with WT minus gametes were incapable of mating structure adhesion and fusion. The WT plus and minus gametes had fused by 10 min, and thus were no longer adhering. e Trimer formation was blocked in the L310E and L448E minus gametes. Equal numbers of minus and plus gametes were mixed for 10 min and lysates were analyzed with semi-native SDS-PAGE and immunoblotting. Lower panels in d and f are alpha tubulin loading controls. f Neither the L310E nor the L448E HAP2 mutant was capable of gamete fusion. WT, L310E and L448E minus gametes were mixed with an equal number of plus gametes for 10 min followed by assessment of gamete fusion. For d and f, results are averages of at least 5 independent experiments with 200 cells counted in each sample. The Kruskal–Wallis test and Dunn’s post-test were utilized to analyze the significance of differences with P values labeled above the groups compared.

