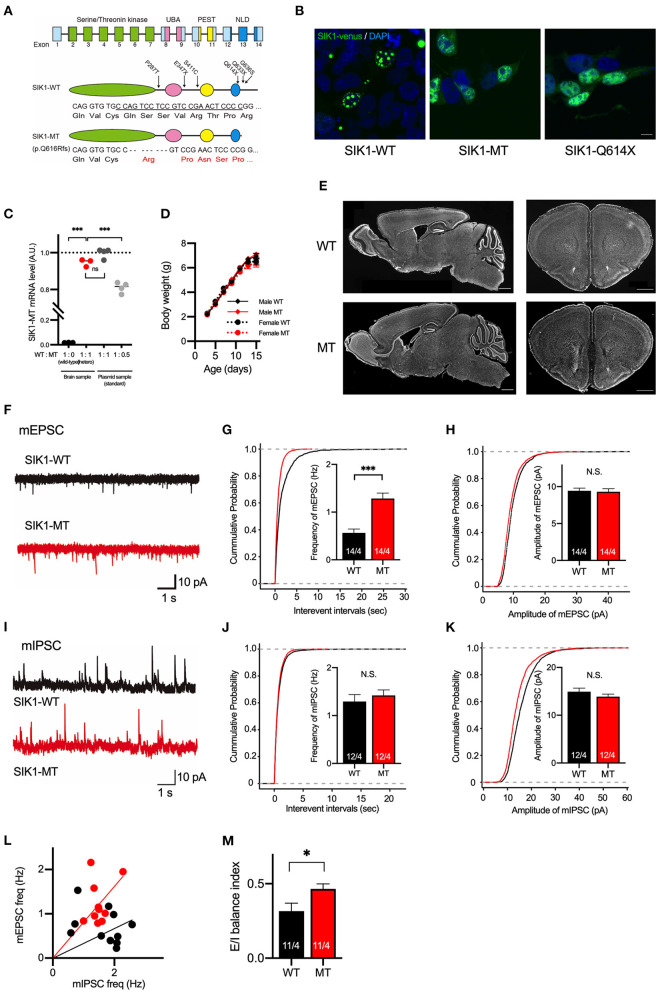
Figure 1.
Generation and basic characterization of the SIK1 MT mice. (A) Genomic organization of SIK1 gene (top), domain structure of wild-type (middle), and mutant SIK1 (bottom) protein. The locations of the mutations identified in human patients are indicated on the domain structure of SIK1-WT. Nucleotide and amino acid sequences of target regions are shown. The target sequence of single guide RNA (sgRNA) is underlined. Converted amino acids after the mutated site are indicated in red. The SIK1 protein consists of four functional domains, including serine/threonine kinase, ubiquitin-associated domain (UBA), proline-glutamate-serine-threonine (PEST), and C-terminal nuclear localization regulatory domain (NLD). Fourteen exons exist in the mouse SIK1 gene. sgRNA was designed to target the coding region in exon 13 of SIK1. (B) Subcellular localization of Venus-tagged SIK1 mutants in HEK293T cells. Wild-type SIK1 was restricted to the nucleus in a punctate pattern, whereas SIK1-MT and pathological nonsense mutant of SIK1-Q614X were distributed both in the nucleus and in the cytoplasm. Scale bar indicates 15 μm. (C) The ratios between wild-type and mutant mRNA were analyzed in a wild-type, heterozygote SIK1-MT, and plasmid DNA mixture containing SIK1-MT at different ratios (WT:MT = 1:1 or 1:0.5), which are used as standards. Mutant SIK1 transcripts were detected at a similar level with plasmid DNA containing 50% of SIK1-MT. (D) Body weights of male wild-type (Male WT), male mutant (Male MT), female wild-type (Female WT), and female mutant (Female MT) mice are shown in the graph. Body weights are unchanged in the SIK1-MT mice. (E) The brain structure is unchanged in the SIK1-MT mice. Sagittal (left) and coronal (right) brain sections were stained with DAPI. Scale bars indicate 1 mm. (F) Representative traces of miniature excitatory postsynaptic currents (mEPSC) recorded from the layer 5 pyramidal neurons in the medial prefrontal cortex (mPFC) of wild-type and SIK1-MT mice. (G) Cumulative distribution of inter-event intervals of and the mean values of the frequency of mEPSCs were shown in the graph. The frequency of mEPSCs was increased in the SIK1-MT mice. (H) Cumulative distribution and the mean values of the amplitude of mEPSCs were shown in the graph. The amplitude of mEPSCs was unchanged in the SIK1-MT mice. (I) Representative traces of mIPSC recorded from the layer 5 pyramidal neurons in mPFC of SIK1-WT and SIK1-MT mice were shown. (J) Cumulative distribution of the inter-event intervals of mEPSC and the mean values of the frequency of mIPSCs were shown in the graph. The frequency of mIPSCs was unchanged in SIK1-MT mice. (K) Cumulative distributions and mean values of the amplitude of mIPSCs were shown in the graph. The amplitude of mIPSCs was unchanged in SIK1-MT mice. (L) The scatter plot shows the relationship between the frequencies of mIPSC (x-axis) and mEPSC (y-axis). Each dot represents a single neuron from WT (black) or MT (red). (M) Excitatory and inhibitory (E/I) synaptic balance index of WT and SIK1-MT mice is shown. E/I balance in SIK1-MT is shifted to excitatory dominance. The numbers of neurons and mice used in each analysis are shown on the bar (neurons/mice) in the graphs. Statistical analysis was made by a one-way ANOVA followed by Bonferroni's post-hoc test (for the EL of SIK1 gene expression) or Student's t-test (for the mean of the synaptic parameters). Statistical significance was indicated by asterisks (*p < 0.05 and ***p < 0.001).

