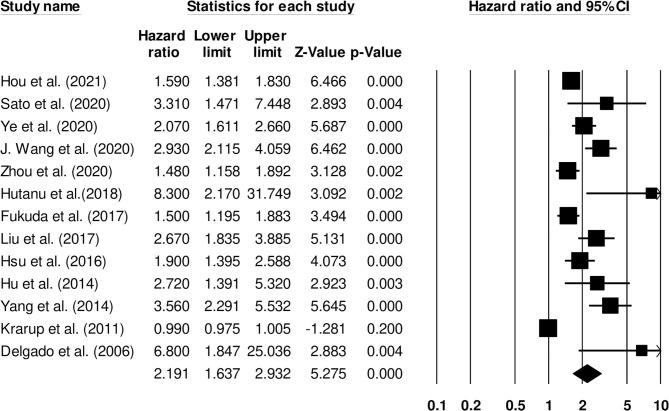
Figure 4.
Forest plot for studies evaluating the impact of D-dimer level on post-stroke functional outcomes. Hazard ratios are presented as black boxes while 95% confidence intervals are presented as whiskers. A small hazard ratio represents a lower influence of D-dimer levels on stroke patient functional outcome while a higher hazard ratio represents a higher influence.

