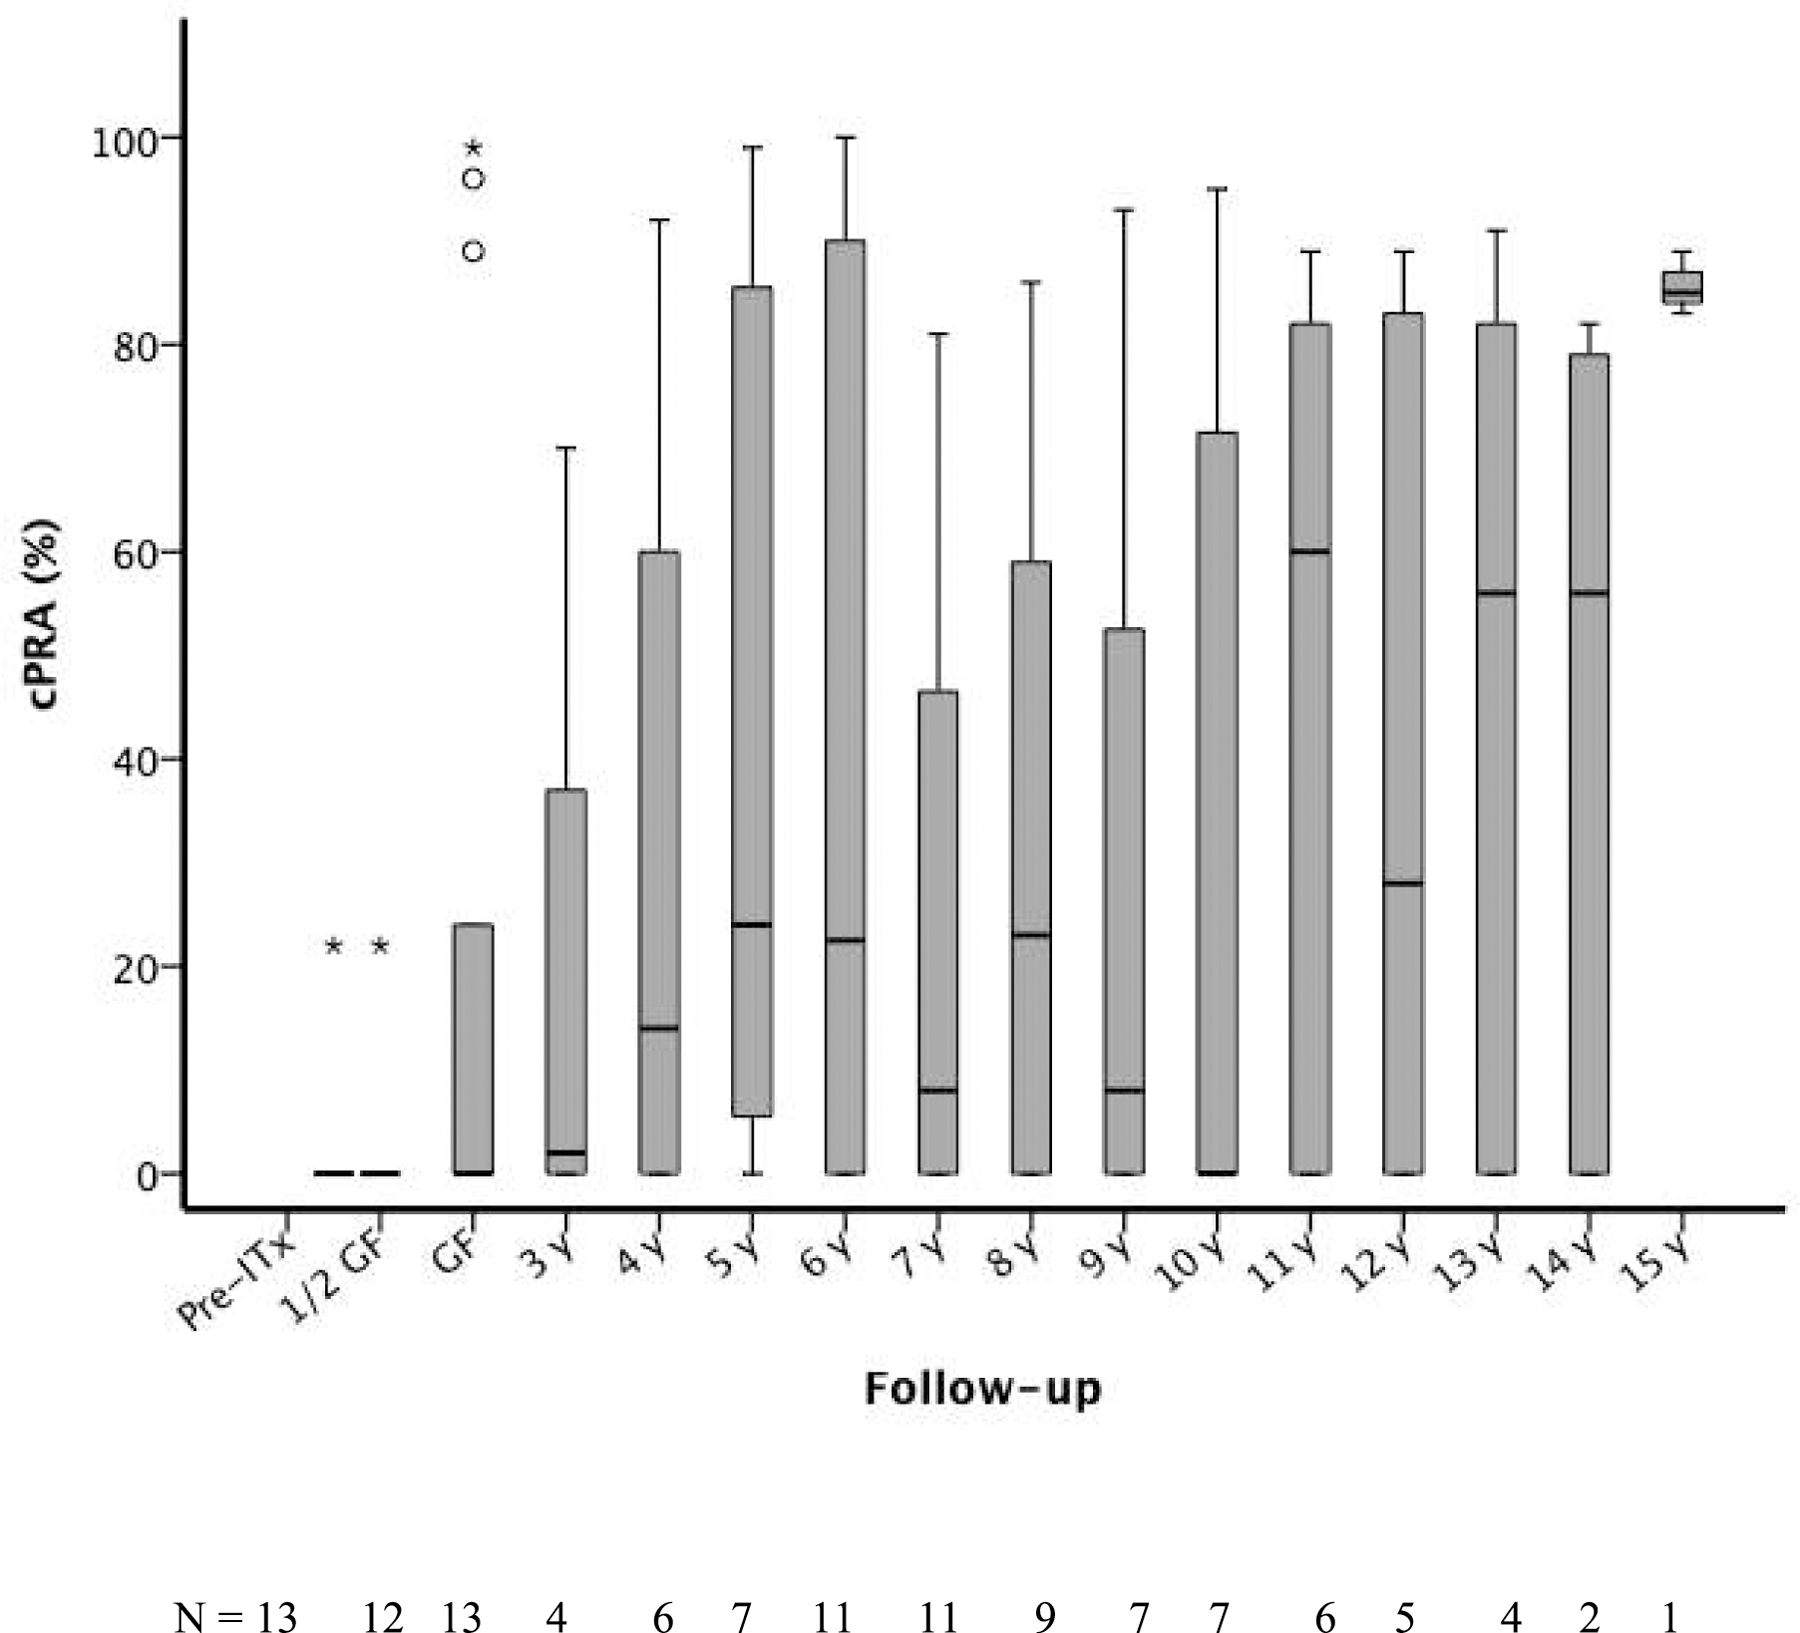
Figure 2 -. Values of cPRA (%) in IA group subjects (n=13) before transplantation, during transplant follow-up and after graft failure. Box plot shows cPRA distribution mean, interquartile range and minimum and maximum values. The lower bar shows the number of patients evaluated at each time point during the follow-up.

Abbreviations: 1/2 GS, half-life graft survival; cPRA, calculated panel-reactive antibody; GF, graft failure; IA, islet transplantation alone; ITx, islet transplantation.
