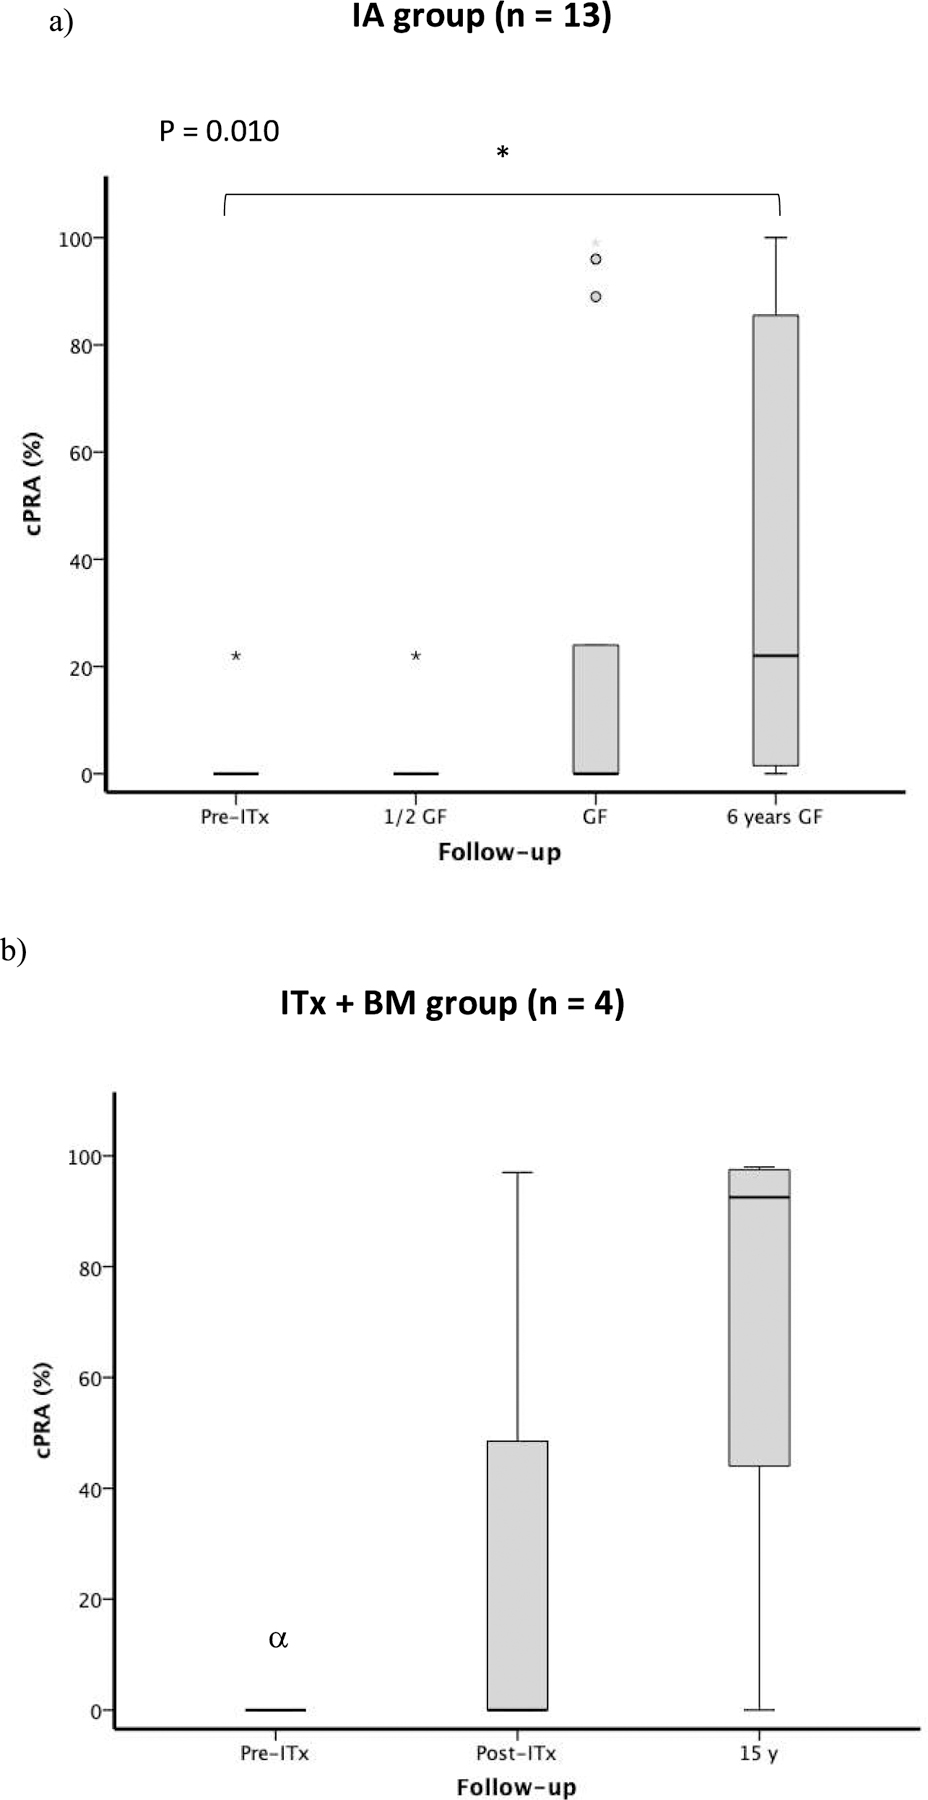
Figure 3 -. Values of cPRA (%) in IA group subjects (n = 13) and ITX + BM subjects (n = 4). Figure 3a shows the change in cPRA (%) before transplantation, ½ time between transplant and graft failure, at graft failure, and 6 years after graft failure in the IA group (n = 13); * Dunn-Bonferroni Post hoc analysis between Pre-ITX and 6 years post GF, P = 0.042. Figure 3b shows the change in cPRA (%) before transplantation, at the time of graft failure, and 15 years after graft failure in the ITx + BM group (n = 4); α cPRA was performed in 2 out of 4 patients before transplant.

Abbreviations: cPRA, calculated panel-reactive antibody; GF, graft failure; IA, islet transplantation alone; ITx + BM, islet transplantation plus bone marrow-derived CD34 + hematopoietic stem cells.
