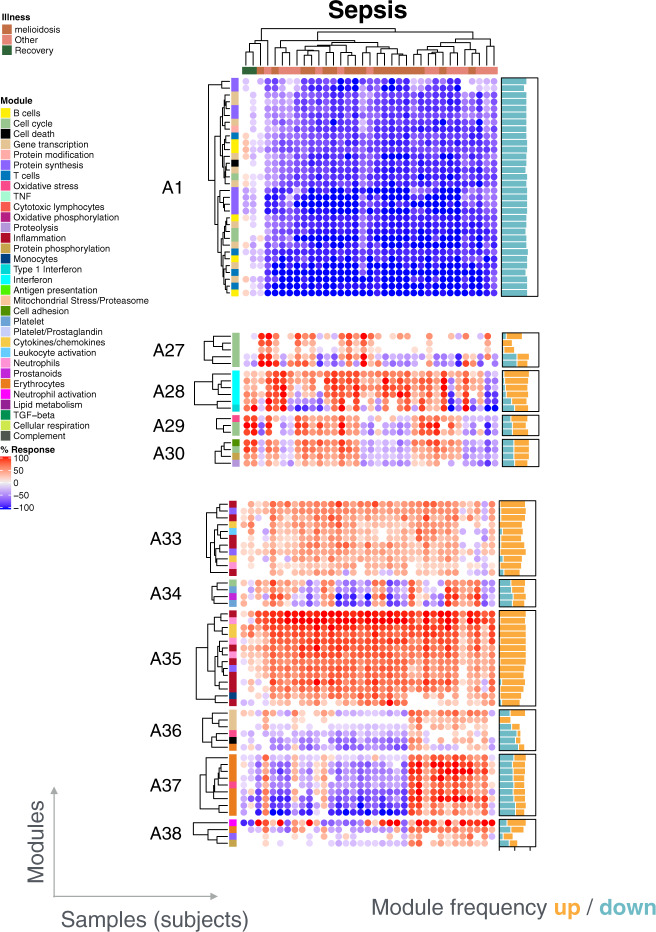
Fig. 5. Individual-level module heatmap.
Changes in transcript abundance were determined at the individual level across all modules constituting the repertoire. These changes are represented on a heatmap, where an increase in abundance of a given module is represented in red, and a decrease in abundance is represented in blue. The subjects are organized as columns and the modules as rows. The order on the heat map was determined by hierarchical clustering.

