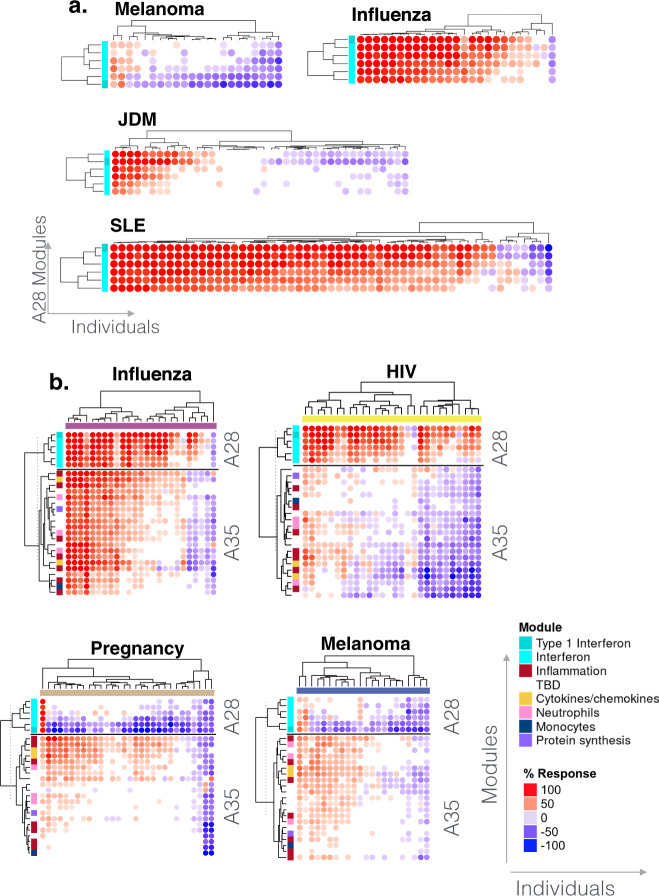
Fig. 9. Abundance patterns across individuals.
a Changes in abundance for A28 modules. The heatmaps display the changes in abundance for the same six modules (rows) across individuals (columns) in four reference cohorts. The rows and columns on the heatmap are arranged based on similarities in abundance patterns. b Changes in abundance for A28 and A35 modules. The heatmaps display the changes in abundance of six modules constituting aggregate A28 and 21 modules constituting aggregate A35 (rows) across individuals (columns) in four reference datasets. Functional annotations associated with different modules are indicated by a color code and corresponding legend. The heatmaps can be accessed and exported for all 16 datasets and 38 module aggregates using the web application: https://drinchai.shinyapps.io/BloodGen3Module/ (under the “MODULES X INDIVIDUALS” tab).

