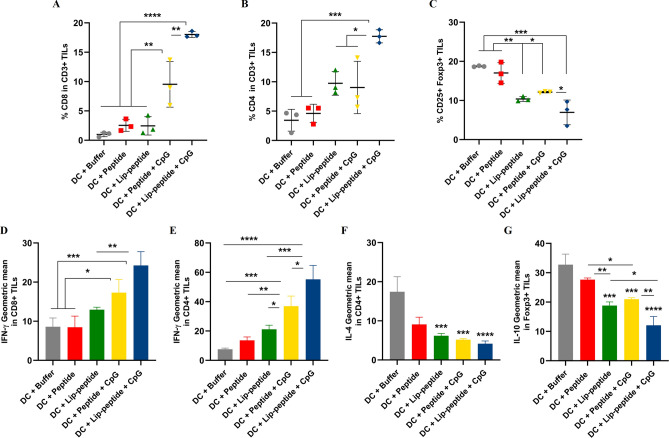
Figure 2.
Immune cell subsets infiltration and cytokine production within the tumor site. The frequency of CD8+ TILs (A), CD4+ TILs (B), CD4+ Foxp3+ TILs (C) and median fluorescence intensity (MFI) of IFN-γ (D, E), IL-4 (F), IL-10 (G) cytokine profile of tumor cells of mice received the combination therapy. The data are presented as mean ± SD (N = 3). Statistically significant differences are shown as follows: *P < 0.05, **P < 0.01, ***P < 0.001, ****P < 0.0001.

