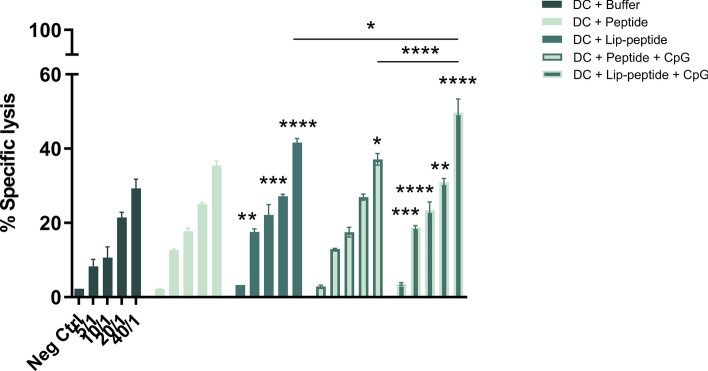
Figure 4.
Antigen-specific cytotoxic cytolysis. Splenocytes isolated from mice received combination therapy. Specific lysis (%) of Calcein AM labeled B16F10 cells expressing gp100 and CT26 (gp100 negative) in co-cultured with splenocytes is depicted per E: T (E: effector cells and T: target cells) ratio. The data are presented as mean ± SD (N = 3). Statistically significant differences are shown as follows: *P < 0.05, **P < 0.01, ***P < 0.001, ****P < 0.0001.

