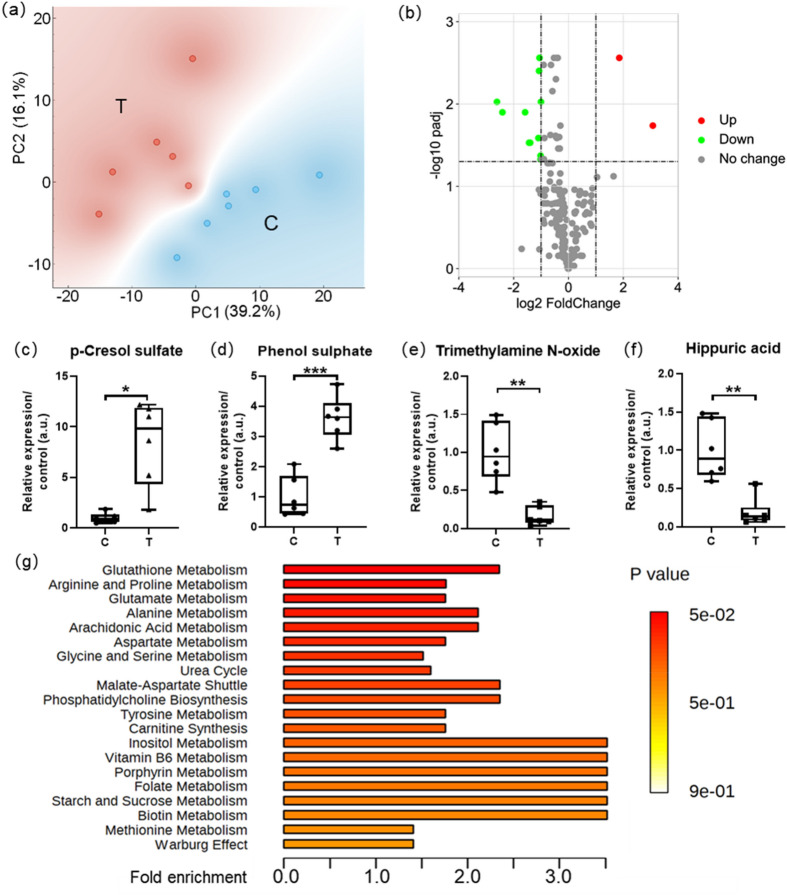
Figure 2.
Untargeted metabolomics revealed aberrantly-regulated metabolites and pathways. PCA results (a) suggested good separation between data groups, volcano plot (b) presented aberrantly-regulated metabolites with padj < 0.05, fold change (T/C) > 2 or fold change reciprocal (reciprocal of fold change value) > 2, boxplots demonstrated the top 4 metabolites: PCS (c), phenol sulphate (d), TMAO (e), hippuric acid (f) with the most significant differences (fold change) between groups, top 20 enriched pathways (g) presented according to results of MSEA. All data were presented as mean ± SEM, n = 6. *P < 0.05; **P < 0.01; ***P < 0.001. C Control, T Tunicamycin.

