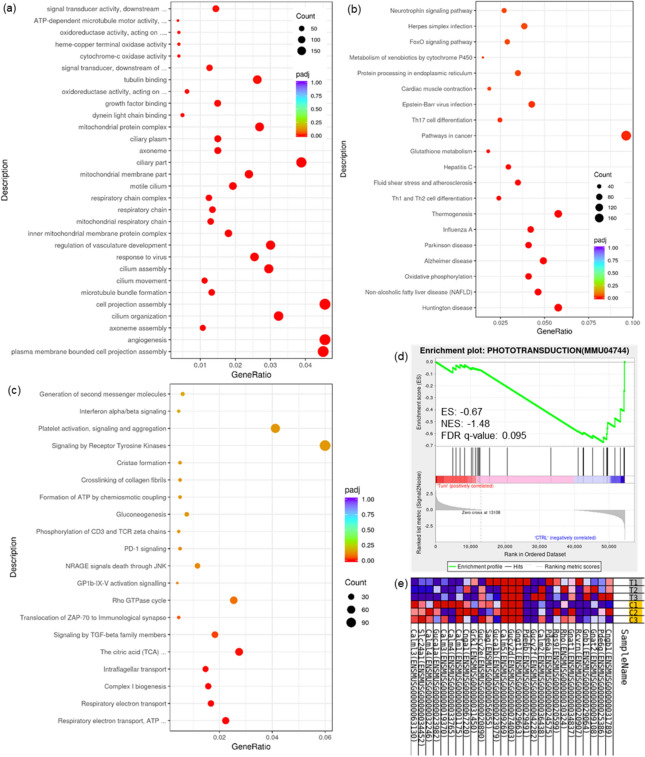
Figure 4.
Multiple pathways aberrantly-regulated revealed by enrichment analyses. Functional enrichment results based on GO (a), KEGG (b) and Reactome (c) database were presented as dot bubble graphs (pathways with ascending significance from top to bottom), GSEA results revealed phototransduction pathway as the most prominently enriched process, up-regulated in response to ER stress: enrichment plot (d) profiling the running enrichment score (ES) and positions of gene set members on the rank ordered list, along with the heatmap (e) showing expression levels of the probed genes involved in the pathway of phototransduction. C/CTRL: Control, T/TUNI: Tunicamycin. The concealed part of the pathways’ names in (a): signal transducer activity, downstream of receptor; ATP-dependent microtubule motor activity, minus-end-directed; oxidoreductase activity, acting on a heme group of donors, oxygen as acceptor; signal transducer, downstream of receptor, with serine/threonine kinase activity; oxidoreductase activity, acting on peroxide as acceptor (from top to bottom); in (c): TCA cycle and respiratory electron transport; respiratory electron transport, ATP synthesis by chemiosmotic coupling, and heat production by uncoupling proteins.

