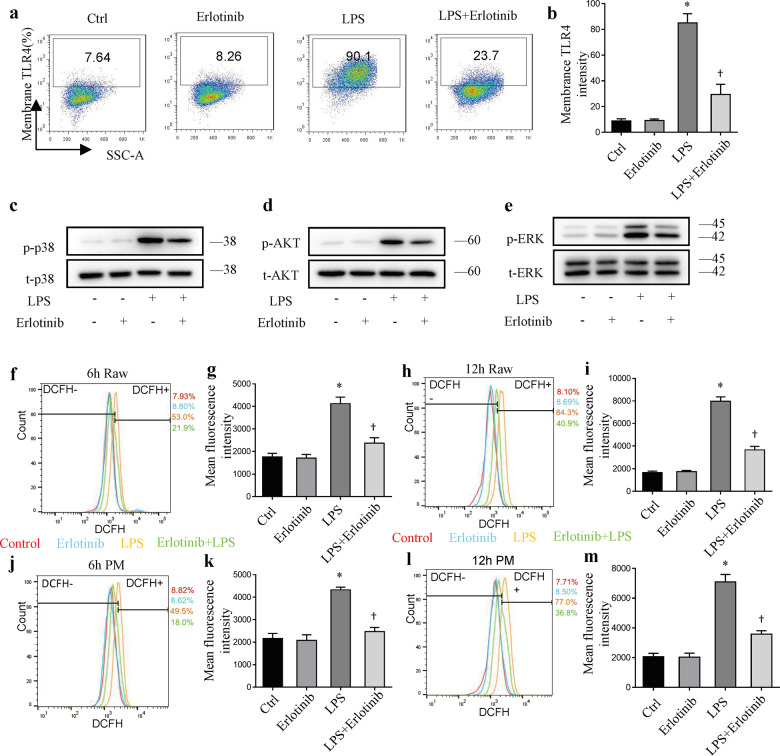
Fig. 4. Cell surface TLR4 expression in response to LPS could be inhibited by erlotinib.
a, b Cell surface TLR4 expression in RAW264.7 cells was analyzed by flow cytometry. c–e Immunoblot analysis of p-p38, t-p38, p-ERK1/2, t-ERK1/2, p-AKT, t-AKT in RAW264.7 cells treated with LPS for 3 h with or without erlotinib pretreatment for 30 min. f, h, j, l ROS production was measured with DCFH2-DA by FACS analysis. g, i, k, m Mean fluorescence intensity of ROS production. Error bars represent SD (n = 3). *P < 0.05 as compared with NC; †P < 0.05 as compared with LPS group.

