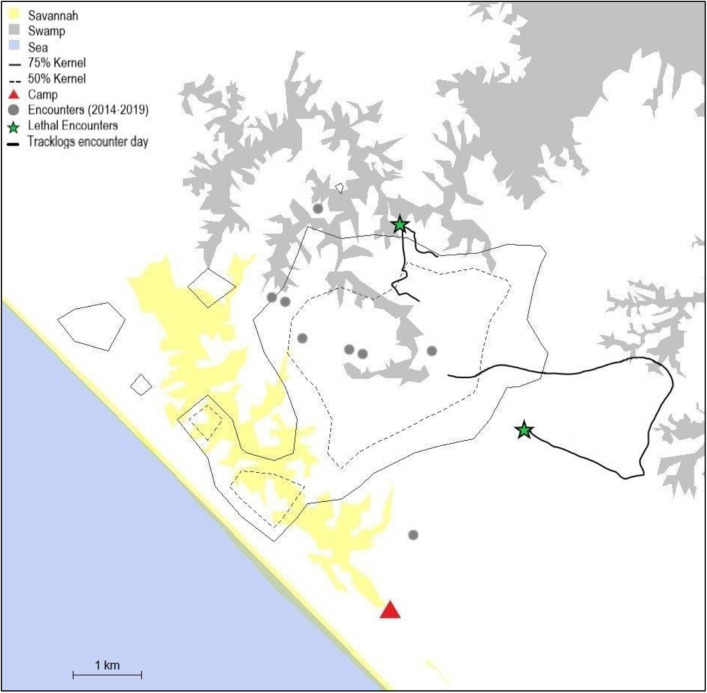
Figure 1.
Map of the study area and location of events. The locations of the two lethal encounters of the 06/02/2019 and the 11/12/2019 are marked with green stars. Nine previous encounters with gorillas (2014–2019) are marked with eight grey circles since two event locations were identical) characterized by peaceful behaviour and, in two cases, co-feeding. The 50% and 75% density isopleth55 of the home range and travel paths based on tracklog data from the two encounter days are marked in broken grey, solid grey and black lines. The figure was generated in R (version 3.6.3, R Core team, https://www.R-project.org/)56 using the package adehabitatHR57.

