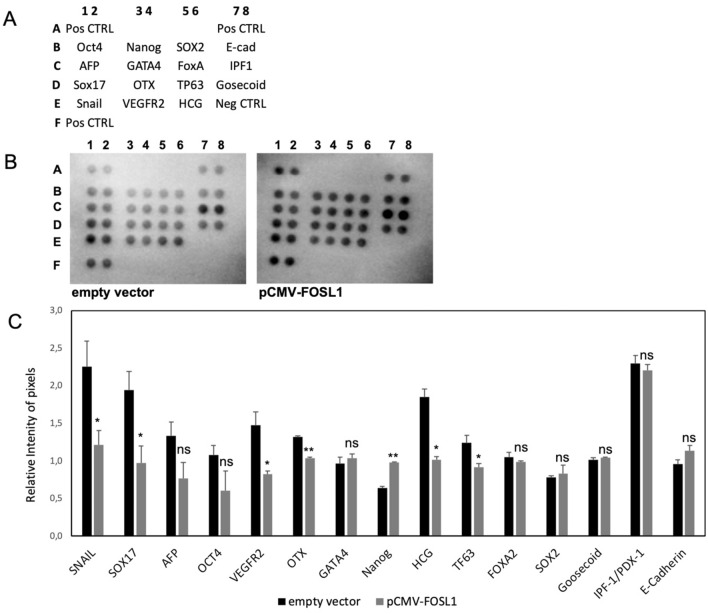
Figure 4.
Staminal markers analysis after the overexpression of FOSL1. (A) Reference positions of the antibodies spotted on the proteome array. (B) Image of the acquisition of the two membranes hybridized with the total protein extract from HEK293T cells transfected for 48 h with empty vector or pCMV-FOSL1. (C) Graphical representation of the pixel quantification of each spot. Data were represented as the mean ± standard deviation of the technical duplicates of the spots presented on the arrays. Results have been normalized for the mean of the positive control spots (3 couple in each membrane). p value < 0.05, *; 0.005 **; 0.0005 *** (t-test data).

