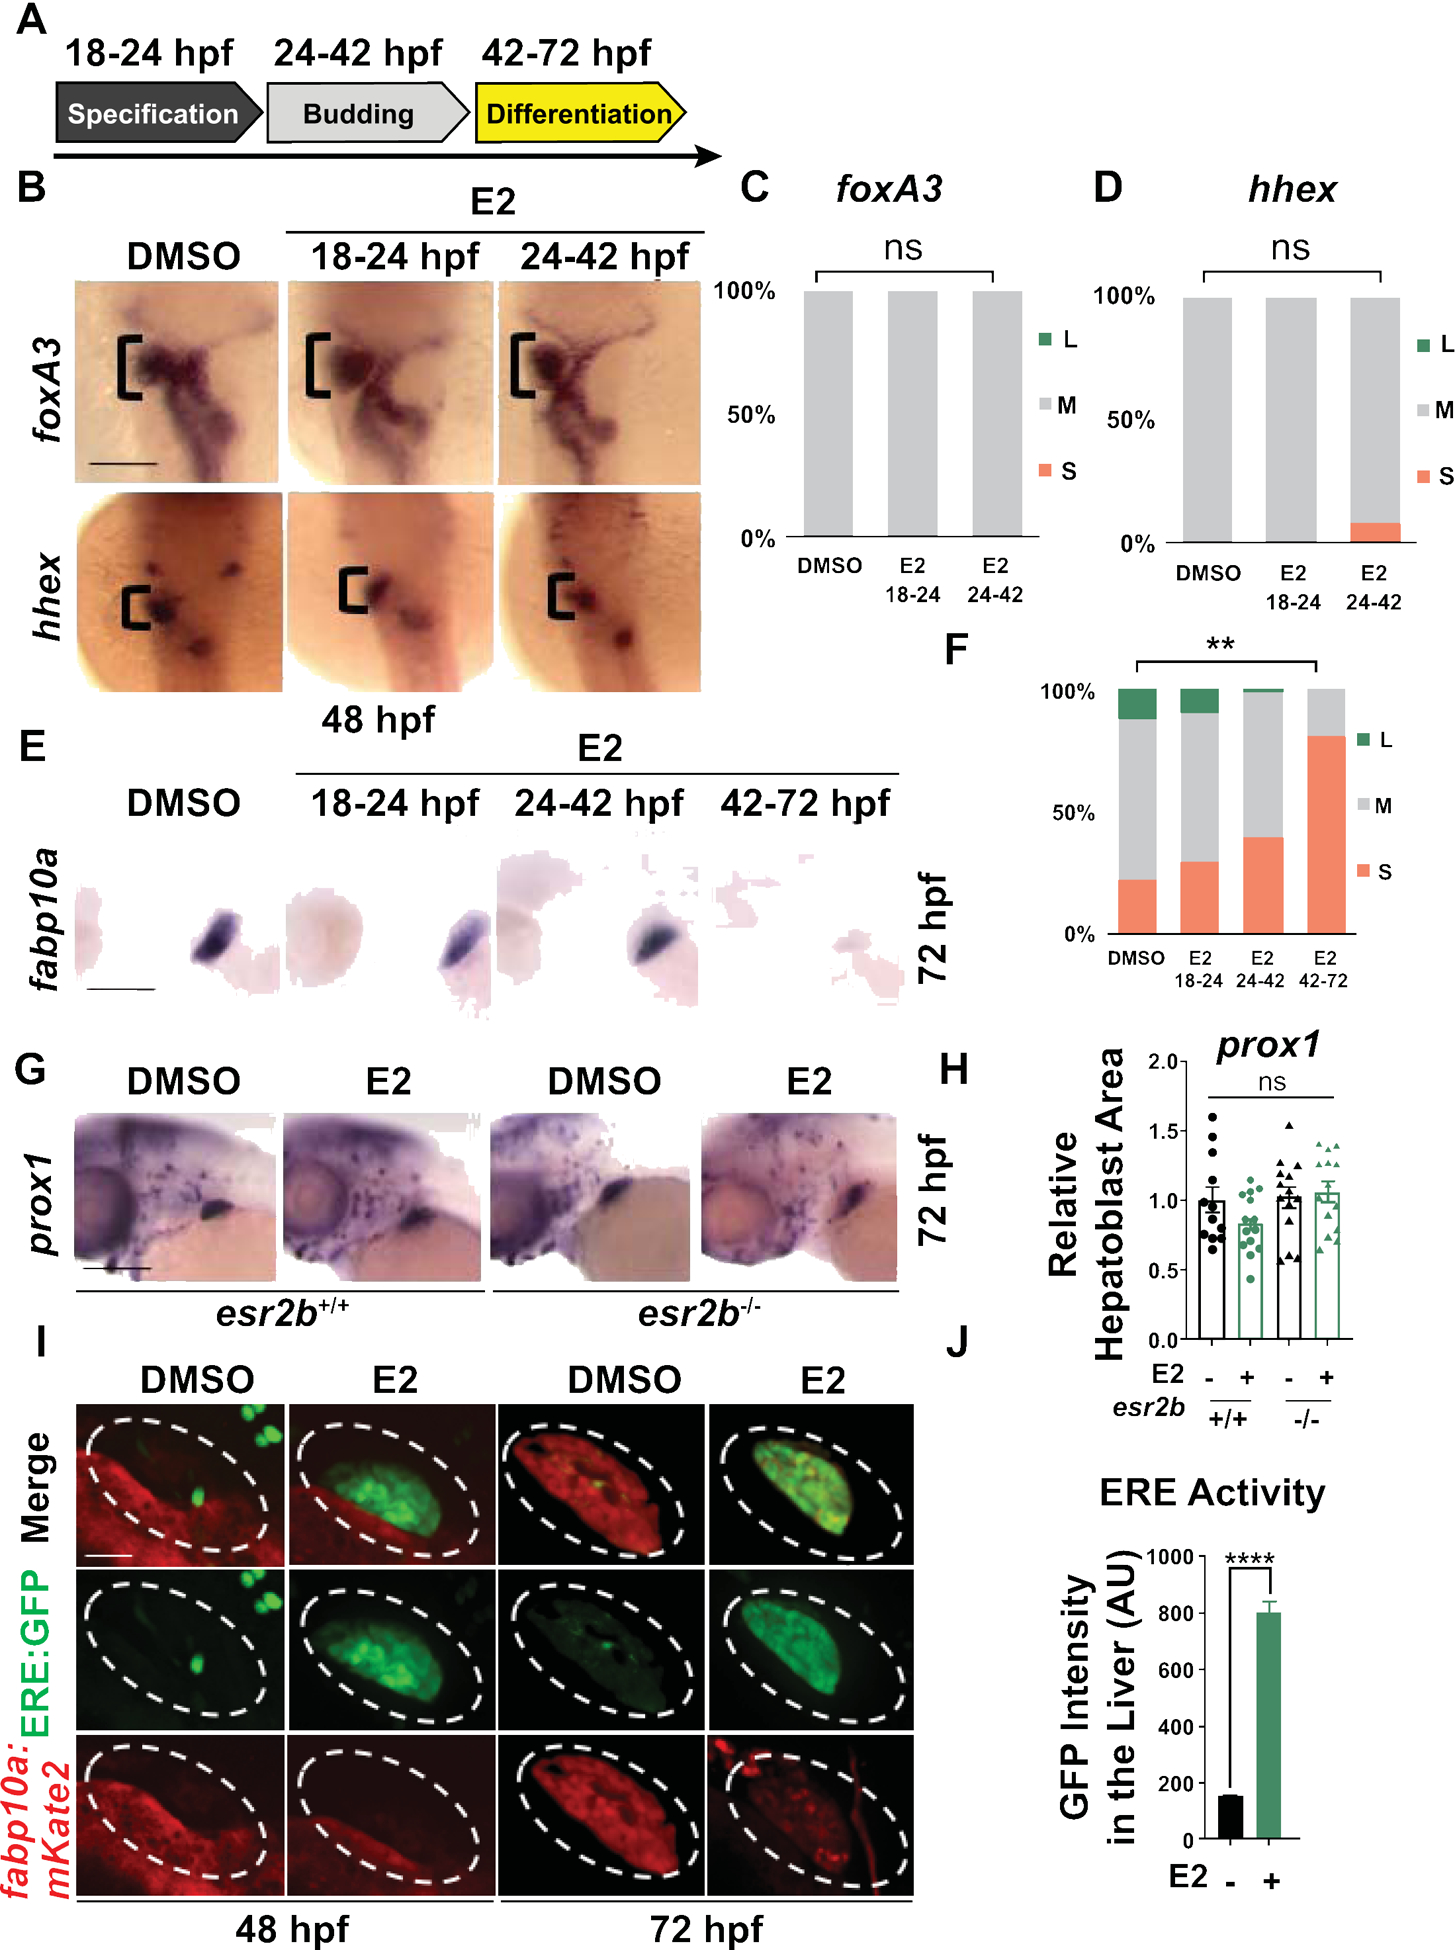
Figure 3. E2 inhibits hepatocyte differentiation.

(A) Scheme illustrating E2 exposure time-windows: 18–24hpf targeting hepatic specification, 24–42hpf targeting hepatoblast budding, 42–72hpf targeting hepatoblast differentiation and maturation. (B) Endoderm (foxa3) and hepatoblast (hhex) markers expressions as assayed by WISH at 48hpf remained mostly unaffected by E2 exposures from 18–24hpf or 24–72hpf. (C-D) Distribution graph of liver size showing % of embryos with large (L, blue), medium (M, gray) or small (S, red) liver. n ≥ 20, ns=not significant, two-tailed Student’s t-test. (E) E2 exposure from 42–72hpf exposure time-window has the most significant impact on fabp10a hepatocyte marker expression. (F) Liver size distribution of embryos exposed to E2 as assessed by WISH for fabp10a at 72hpf as % of embryos with large (L, blue), medium (M, gray) or small (S, red) livers. n ≥ 51, **p<0.01, two-tailed Student’s t-test. (G) Expressions of hepatic progenitors (prox1) of esr2b+/+ and esr2b−/− embryos exposed to DMSO or E2 from 24–72hpf at 72hpf. (H) Quantification of prox1 expression at 72hpf by ImageJ. n ≥ 11, ns=not significant, two-way ANOVA. (I) Co-localization of nuclear estrogen receptor activity in hepatocytes in bigenic zebrafish Tg(fabp10a:DsRed; 5xERE:GFP) exposed to DMSO or E2 from 24–72hpf at 48 and 72hpf. Scale bar =70μm (J) Quantification of GFP intensity in the liver area (AU), ****p<0.0001, n ≥ 10, one-way ANOVA. Scale bars =200μm. All values represent mean ± SEM.
