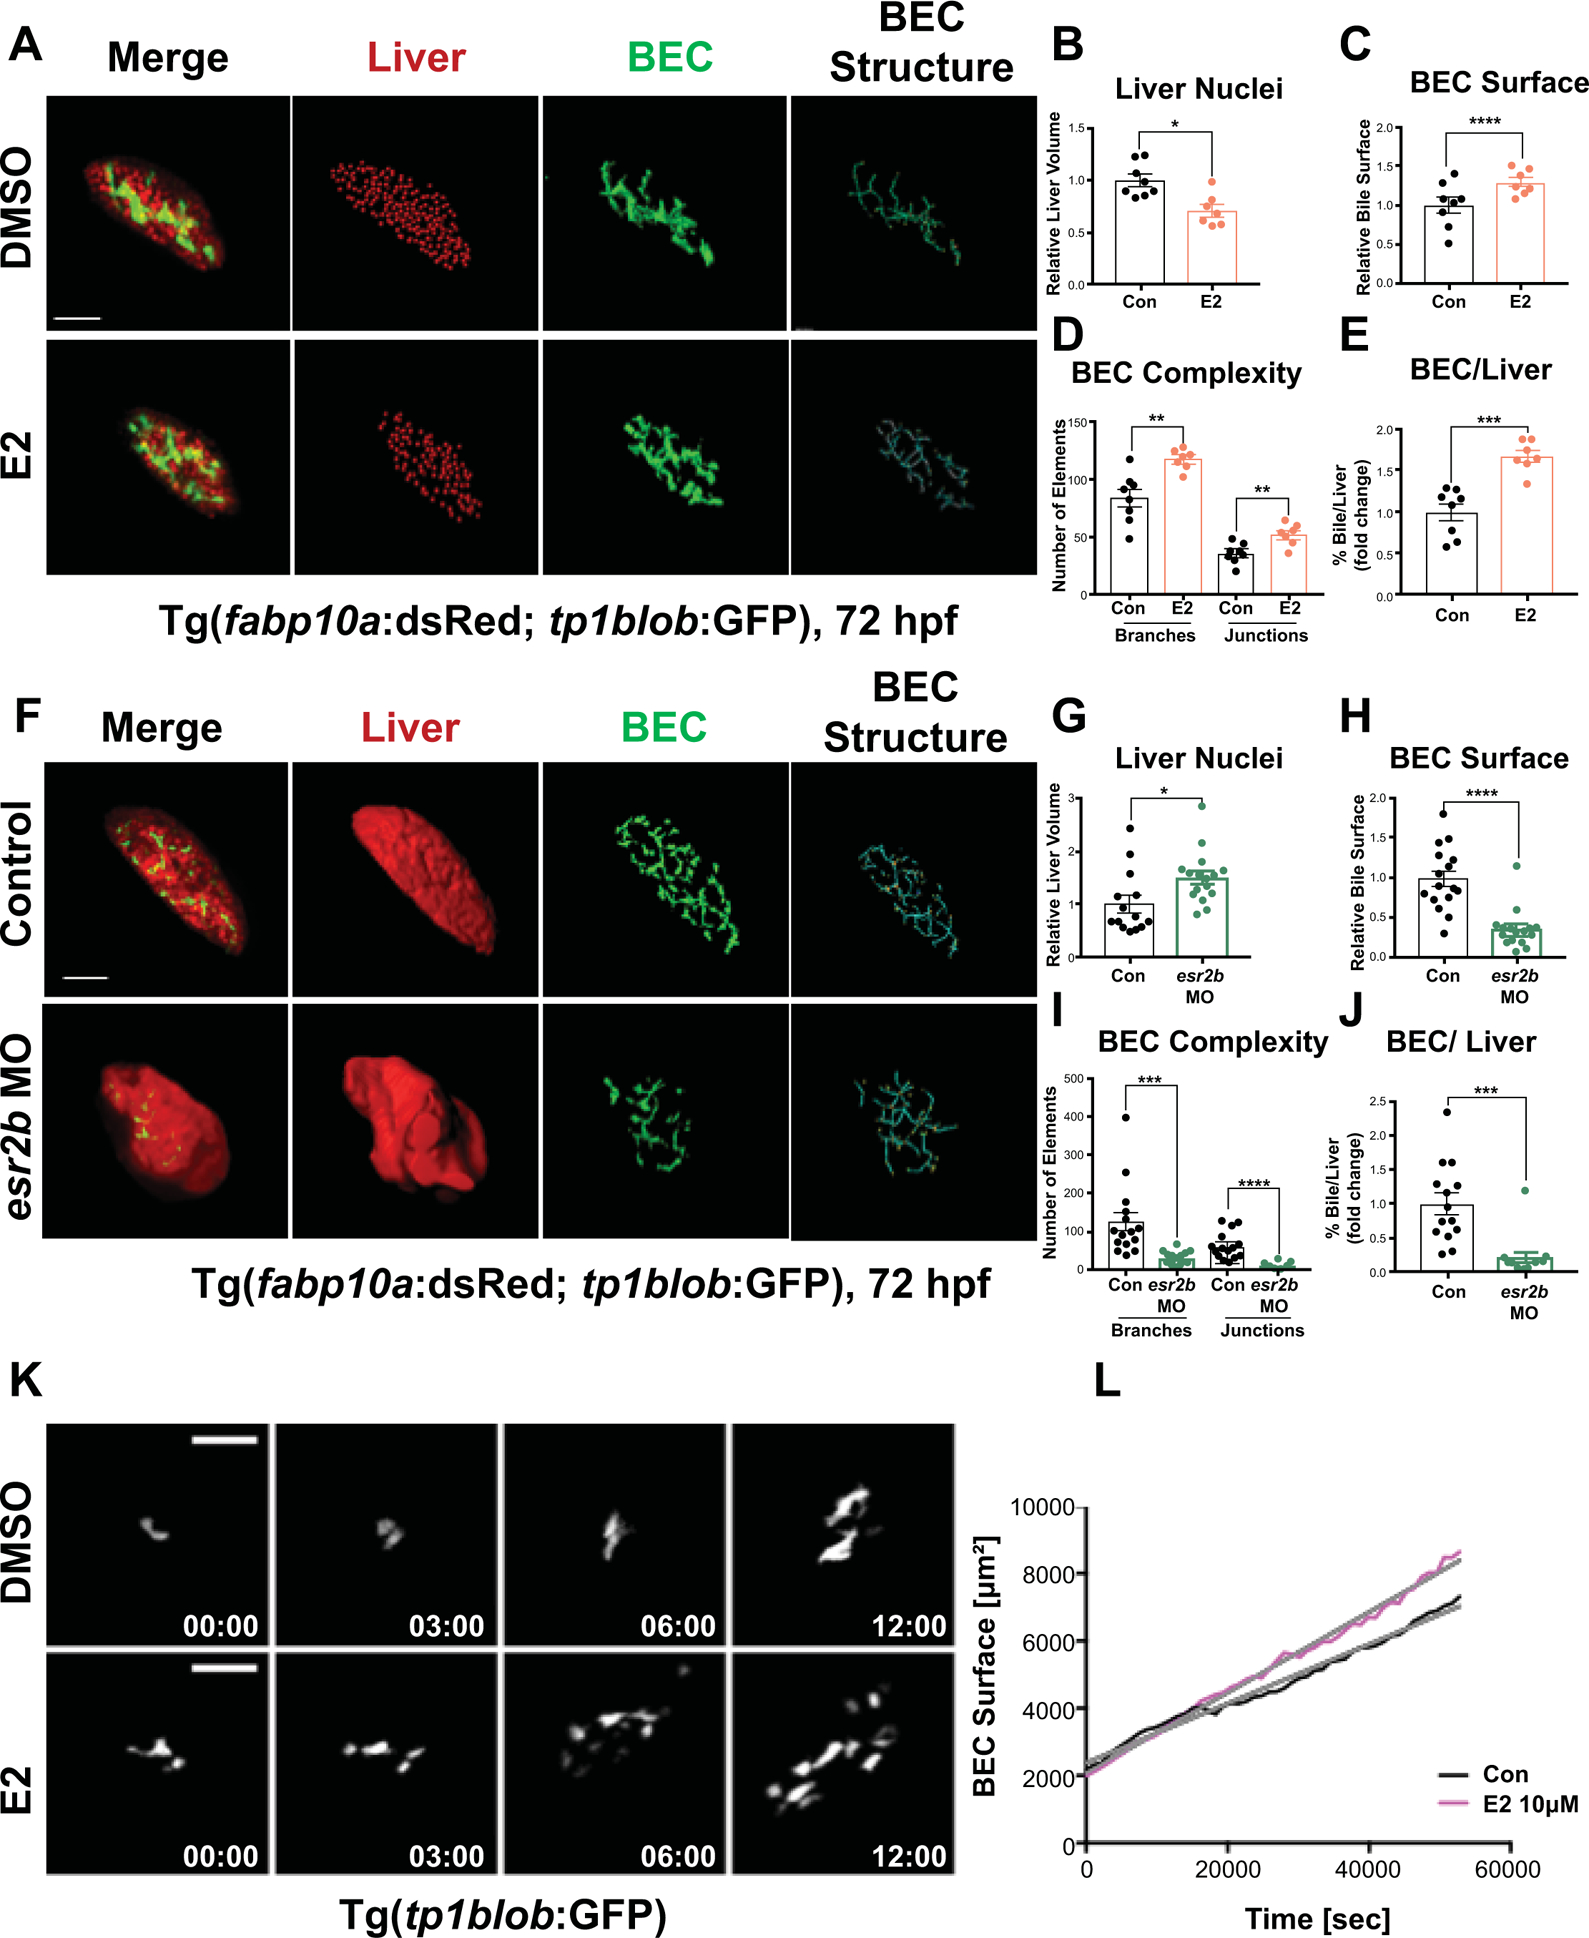
Figure 4. E2/esr2b activity controls hepatobiliary fate decisions.

(A) Representative images of bigenic Tg(fabp10a:dsRed; tp1blob:GFP) embryos at 72hpf exposed to DMSO or E2 from 24–72hpf. Quantification of number of liver nuclei (B), Biliary surface area (C), Biliary tree complexity (D), and biliary surface area/number of liver nuclei ratio for individual embryos (E). *p<0.05, **p<0.01, ***p<0.001, ****p<0.0001, one-way ANOVA. (F) Representative images of esr2b MO injected or non-injected control bigenic Tg(fabp10a:dsRed; tp1blob:GFP) embryos at 72 hpf. Quantification of number of liver nuclei (G), Biliary surface area (H), Biliary tree complexity (I), and biliary surface area/number of liver nuclei ratio for individual embryos (J). *p<0.05, ***p<0.001, ****p<0.0001, one-way ANOVA. (K) Time-lapse images showing dynamic growth of BEC in Tg(tp1blob:GFP) embryos for 16 hours from 55–72 hpf. These embryos were exposed to DMSO or E2 starting at 30 hpf. (L) Quantification of BEC surface areas (μm2) of Tg(tp1blob:GFP) embryos exposed to DMSO or E2 from 30 hpf. All images were quantified by Imaris 9 software, all values represent mean ± SEM, scale bars = 70μm.
