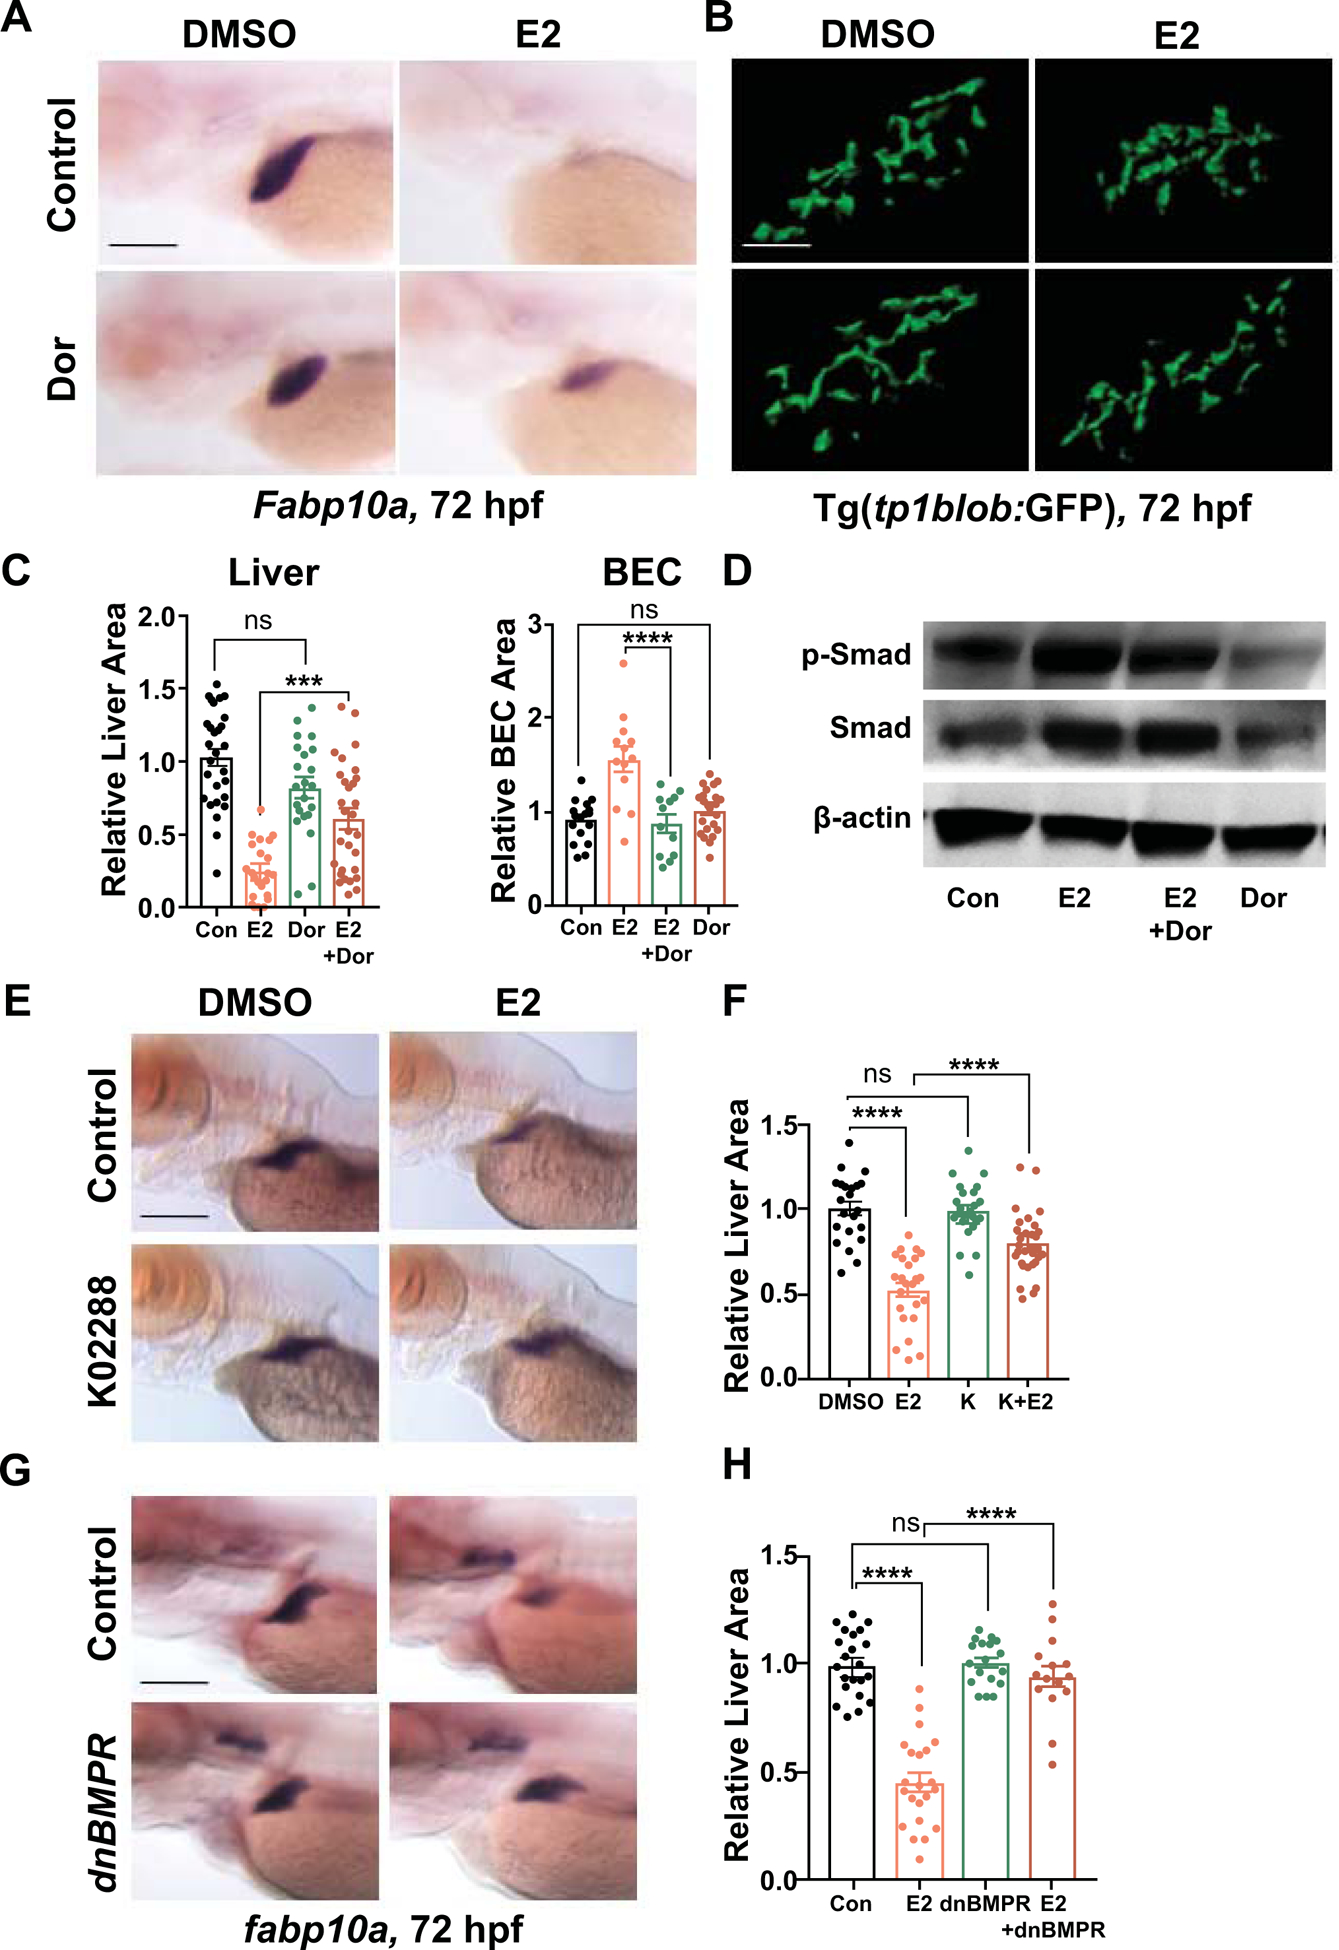
Figure 6. E2 signals through BMP pathway to impact hepatobiliary development.

(A) Representative images of zebrafish embryos exposed to DMSO, E2 (10 μM), Dorsomorphin (10μM), or E2+Dorsomophin from 24–72hpf at 72hpf. Liver size assessed by WISH for fabp10a at 72 hpf. (B) Confocal images of BEC surface area of Tg(tp1blob:GFP) embryos exposed to DMSO, E2 (10μM), Dorsomorphin (10μM), or E2+Dorsomophin from 24–72hpf at 72hpf. Scale bar = 40μm. (C) Liver area quantified by ImageJ analysis and BEC surface area quantified by Imaris 9 imaging software. n ≥ 12, ns=not significant, ***p<0.001, ****p<0.0001, one-way ANOVA. (D) Immunoblot of p-Smad, total Smad, and β-actin of embryos treated with DMSO, E2 (10μM), Dorsomorphin (10μM), or E2+Dorsomophin from 24–72 hpf at 72 hpf. (E) Representative images of embryos exposed to DMSO, E2 (10μM), K02288 (5μM), or E2+K02288 from 24–72hpf at 72hpf. (F) Quantification of liver area at 72hpf. ns=not significant, ****p<0.0001, n ≥ 22, one-way ANOVA. (G) Representative images of dnBMPR embryos exposed to DMSO or E2 (10μM), from 24–72hpf at 72hpf. (H) Quantification of liver area at 72hpf. ns=not significant, ****p<0.0001, n ≥ 15, one-way ANOVA. All values represent mean ± SEM, scale bars = 200μm.
