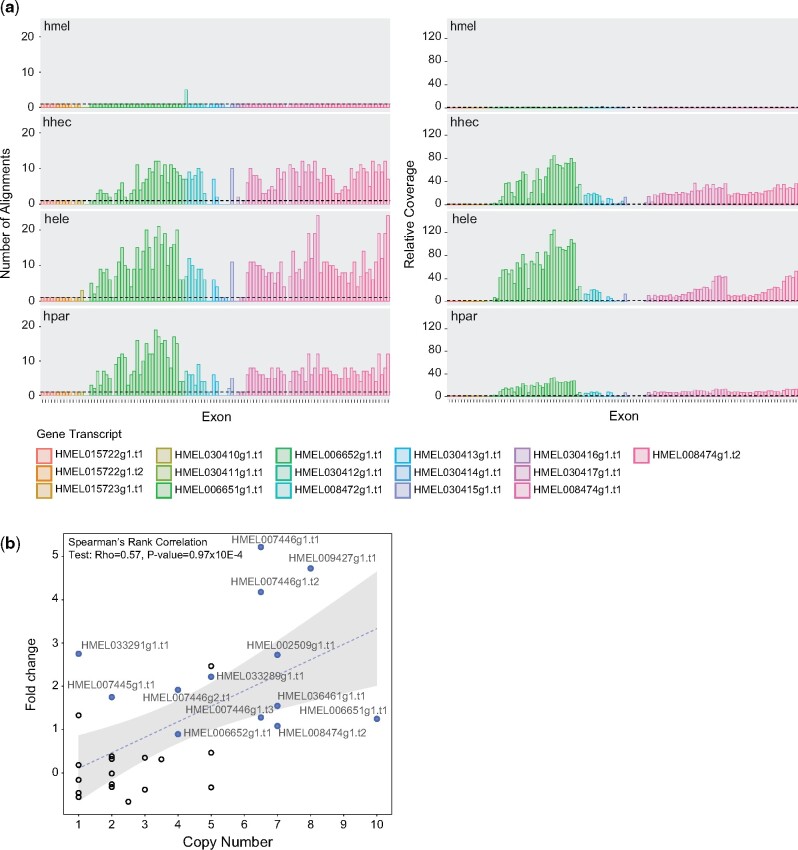
Fig. 3.
CNV and increased expression levels of genes in the repeat region on chromosome 9. (a) CNV for each exon of genes in the chromosome 9 repeat region. The number of alignments (left panel) and relative coverage (right panel) were used as proxies of copy number. The number of alignments was obtained by aligning exon sequences, as annotated in the H. melpomene reference genome, to the reference guided assemblies. Relative coverage was calculated by dividing exon coverage by the median genomic coverage, based on mappings to the H. melpomene reference. Dashed horizontal lines on both plots represent a copy number of one. Our new H. melpomene assembly was also included as a control. (b) Change in expression level in H. pardalinus compared with H. melpomene (y axis) as a function of H. pardalinus transcript copy number (x axis). For each transcript, copy number was calculated as the median number of alignments across exons for the H. pardalinus sample. Full blue circles represent transcripts for which the levels of expression in H. pardalinus were significantly higher than in H. melpomene. The best fit linear model regression line and confidence intervals are depicted by the dashed line and gray band, respectively. Species codes are as in figure 1.

