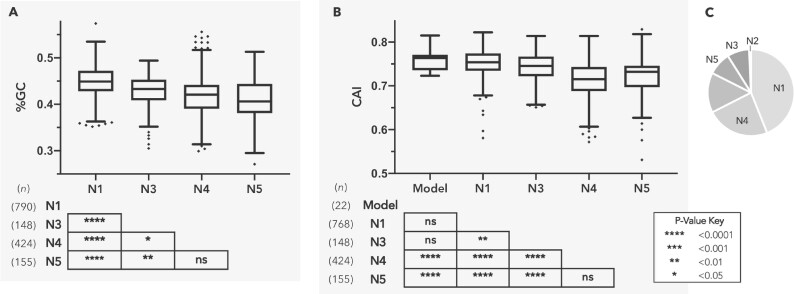
Fig. 4.
HGT was a major contributor to gene accumulation in C. burnetii’s ancestors. Nodes N1–N5 (as labeled in fig. 1) represent major branchpoints in the evolution of C. burnetii. (A and B) depict %GC and Codon Adaptation Index (CAI) distributions, respectively, for genes originating at each node. Boxes illustrate each distribution’s interquartile range while the black line dividing the box represents the median. Whiskers represent minimum and maximum values, excluding outliers (black diamonds) which were determined using the Tukey method. P-values shown in tables are for pairwise T-tests (pooled SD, BKY adjusted). Genes gained at N2 were excluded due to small sample size (n = 13). (C) Coxiella burnetii genome composition based on nodes of gene origin: N1: 43.9%, N2: 0.7%, N3: 8.2%, N4: 22.6%, N5: 8.6%. The unlabeled portion represents potentially spurious genes (n = 224) as well as genes with undefined nodes of origin (n = 44).

