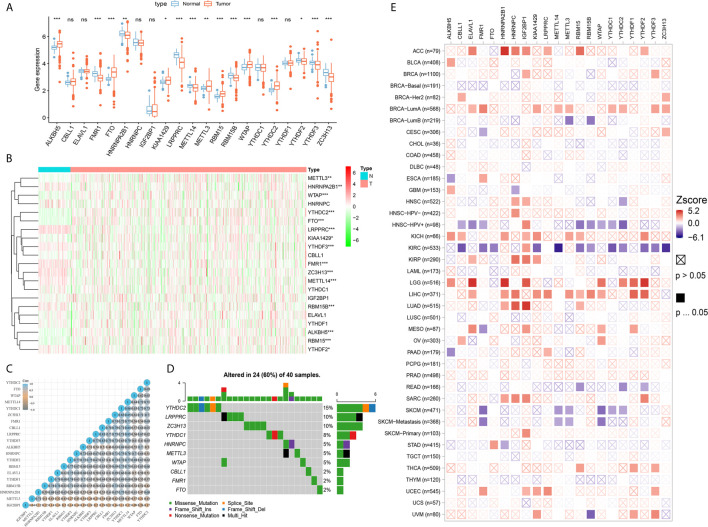
Figure 2.
Differential expression, copy number variation landscape and prognostic implications of 21 m6A regulators in cancers. (A) Differential expression level of 21 m6A regulators in tumor and normal tissues were assessed using Student’s t test. (B) A heat map indicating the m6A modification patterns between tumor tissues and normal tissues. (C) A heat map of the correlation between 21 m6A regulators. The horizontal and vertical coordinates represent genes, and different colors represent correlation coefficients. (D) Oncoplot displaying the somatic landscape of 21 m6A regulator in ccRCC samples from TCGA database. Mutation information of each gene in each sample was shown in the waterfall plot, where different colors with specific annotations at the bottom meant the various mutation types. (E) Clinical implications of 21 m6A regulators expression across various cancer types was estimated in a heatmap using Cox regression methods (ns, not significant; *p < 0.05, **p < 0.01, ***p < 0.001).

