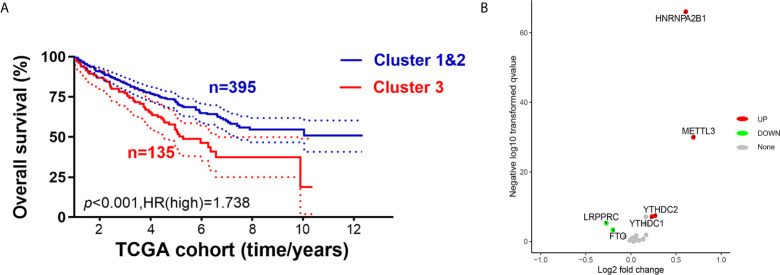
Figure 4.
Cluster 3 exhibited distinct clinical malignant biological phenotype and suppressive immune microenvironment than cluster 1&2. (A) We integrated cluster 1&2 and made comparisons of survival benefits between m6AMS cluster 3 (n = 135) and cluster 1&2 (n = 395) using Kaplan–Meier method. (B) Volcano plots were constructed using fold-change values and adjusted P. The red point represents the up-regulated and the blue point indicates the down-regulated m6A regulators with statistical significance between cluster 3 and cluster 1&2.

