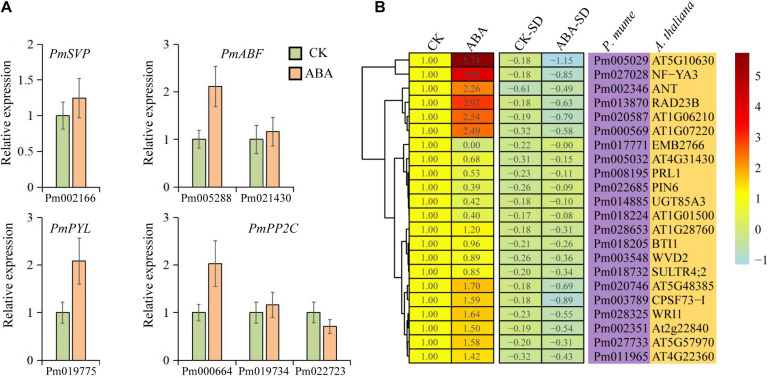
FIGURE 6.
Expression patterns of candidate genes under abscisic acid (ABA) treatment. (A) qRT-PCR of 7 selected genes under ABA treatment. (B) Heatmap of 22 genes under ABA treatment. CK represents the control group, ABA represents the ABA treatment group, and CK-SD and ABA-SD represent the standard deviations of relative expression levels in the groups, respectively.

