Figure 3:
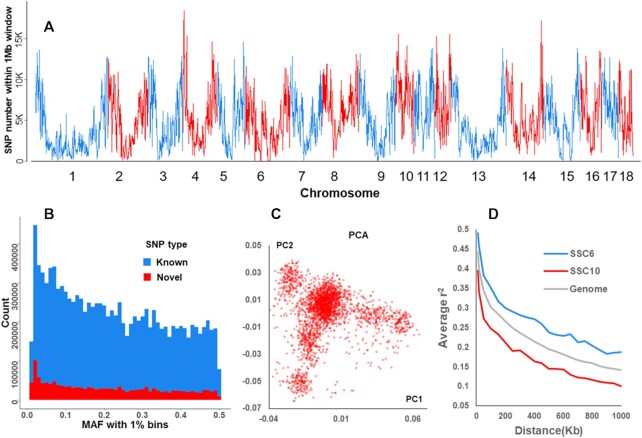
Genetic diversity of the Duroc population. (A) The distribution of SNPs in 1-Mb windows across the genome. (B) Histogram of allele counts by each 1% MAF bin. Novel (red) and known SNP sets (blue) were defined by comparing them to the pig dbSNP database. (C) Principal component 1 and 2 distribution in the Duroc population. (D) The extent of linkage disequilibrium (LD), in which the LD on chromosomes 6 (SSC6) and 10 (SSC10) represent the highest and lowest levels across the whole genome, respectively.

