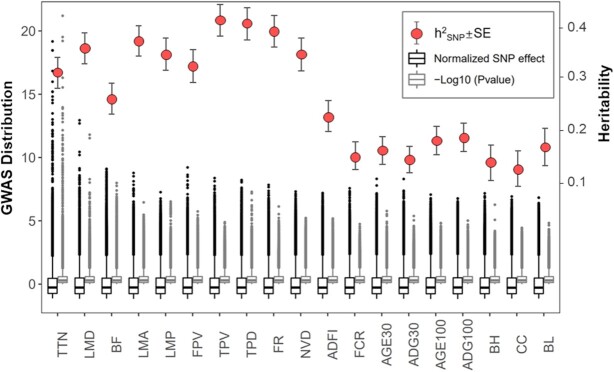
Figure 6:
Heritability and SNP significance and normalized effect of 21 traits. The SNP effect was estimated and normalized and is displayed in the black boxplot. The grey boxplot represents the distribution of −log10 P-values for all SNPs. Red dots represrent heritability estimates, while black lines represent standard error. The boxes represent interquartile range (IQR), the whiskers represent 1.5 times IQR and individual points are outliers.

