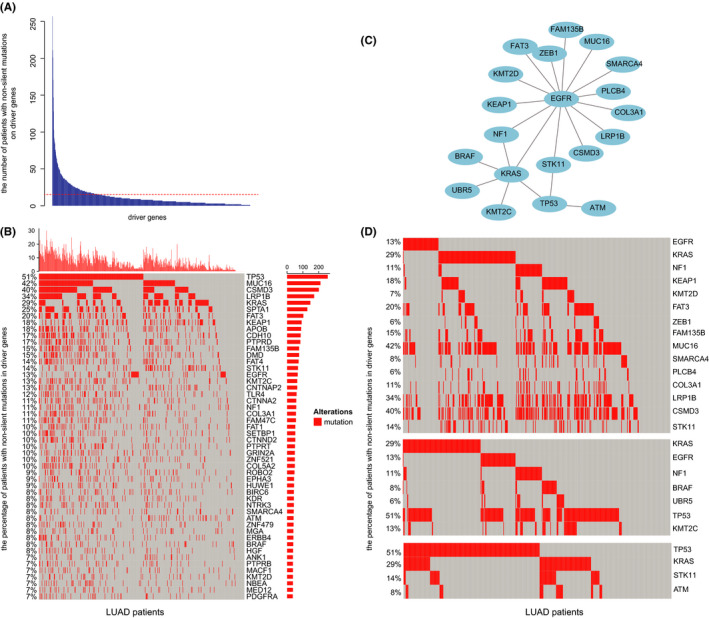
FIGURE 1.

The mutually exclusive events of driver gene mutations across LUAD patients. (A) The numbers of LUAD patients with non‐silent mutations in driver genes. The red line indicated 15 patients. (B) Heatmap of the top 50 frequently mutated driver genes. The red square represented the mutations of driver genes. The X‐axis means LUAD patients and the Y‐axis means the percentage of patients with non‐silent mutations in driver genes. (C) All 21 mutually exclusive events were identified in 178 driver gene mutations, including 20 driver genes. (D) The mutual exclusivity of EGFR mutations, KRAS mutations, or TP53 mutations. Each column represents mutated tumors. The X‐axis means LUAD patients and the Y‐axis means the percentage of patients with non‐silent mutations in driver genes
