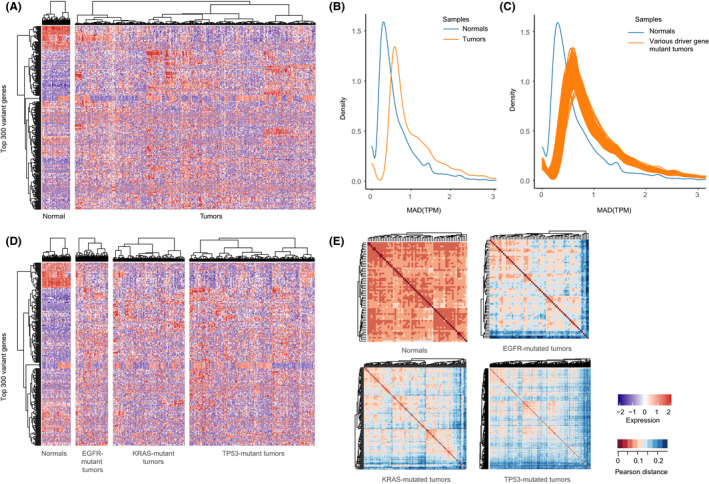
FIGURE 2.

High transcriptomic heterogeneity in tumors with driver gene mutations. (A) A heatmap showed the unsupervised hierarchical clustering of LUAD tumors (n = 506) and normal samples (n = 59) by the most variable genes (n = 300). (B) The MAD distribution of all genes across all tumor and normal samples. The blue and orange lines representing tumor and normal samples, respectively. (C) The MAD distribution of all genes across samples with driver gene mutations. The blue and orange lines representing gene‐mutated tumors and normal samples, respectively. (D) A heatmap was shown by unsupervised hierarchical clustering of the most variable genes (n = 300) among EGFR‐, KRAS‐, and TP53‐mutated tumors and normal samples. (E) Pairwise comparison of transcriptomic profiles in normal samples and EGFR, KRAS, and TP53 mutant tumors. The heatmaps were plotted using unsupervised hierarchical clustering with Pearson distance (1‐Pearson correlation coefficient)
