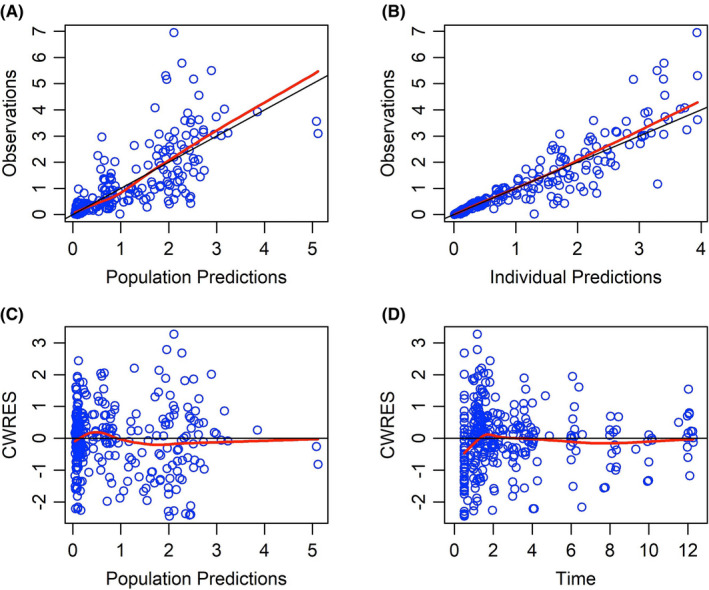
FIGURE 3.

Goodness of fit plots for the final population model of docetaxel. (A) Population predicted concentration (mg/L) or (B) individual predicted concentration (mg/L) versus observed concentrations (mg/L), (C) population predicted concentrations (mg/L) versus conditional weighted residuals (CWRES) (D) time (h) versus conditional weighted residuals
