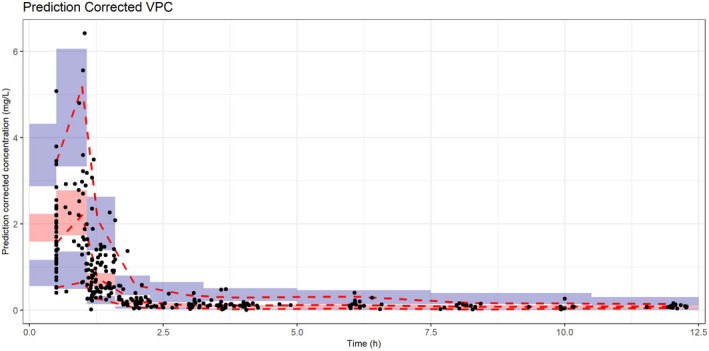
FIGURE 4.

Prediction corrected visual predictive check (VPC). The black dots represent the prediction corrected observations. The red dashed lines are the 90% interval and median of the prediction corrected observations. The red shaded area is the 95%‐confidence interval (CI) of the median prediction, blue shaded area is the 95%‐CI of the 5th and 95th prediction interval
