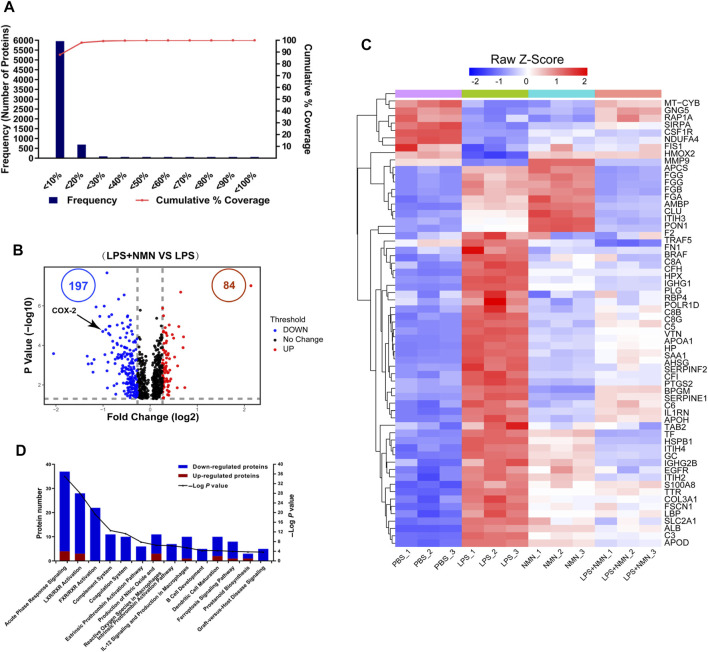
FIGURE 4.
Functional classification of differentially expressed proteins (DEPs) from proteomics analysis of LPS-NMN-treated RAW264.7 cells as compared with LPS-treated cells. (A) Experimental variations of proteomics analysis in this study. (B) The volcano plot shows differentially expressed proteins (DEPs) in LPS-NMN-treated cells as compared with LPS-treated cells. The red and blue dots indicate the significantly changed proteins with fold-change > 1.2 or <0.83 and p value <0.05. COX-2 is highlighted. (C) 61 differentially expressed proteins were found based on the filter conditions that fold change (LPS and NMN co-treated cells versus LPS-treated cells) > 1.2 or <0.83-fold in LPS-induced activated macrophages. (D) The ingenuity pathway analysis for DEPs in LPS-NMN-treated cells as comparing with LPS-treated cells. The red bar represented up-regulated proteins, and blue represented down-regulated (LPS-treated cells versus untreated cells > 1.2-fold or < 0.83, P < 0.05).

