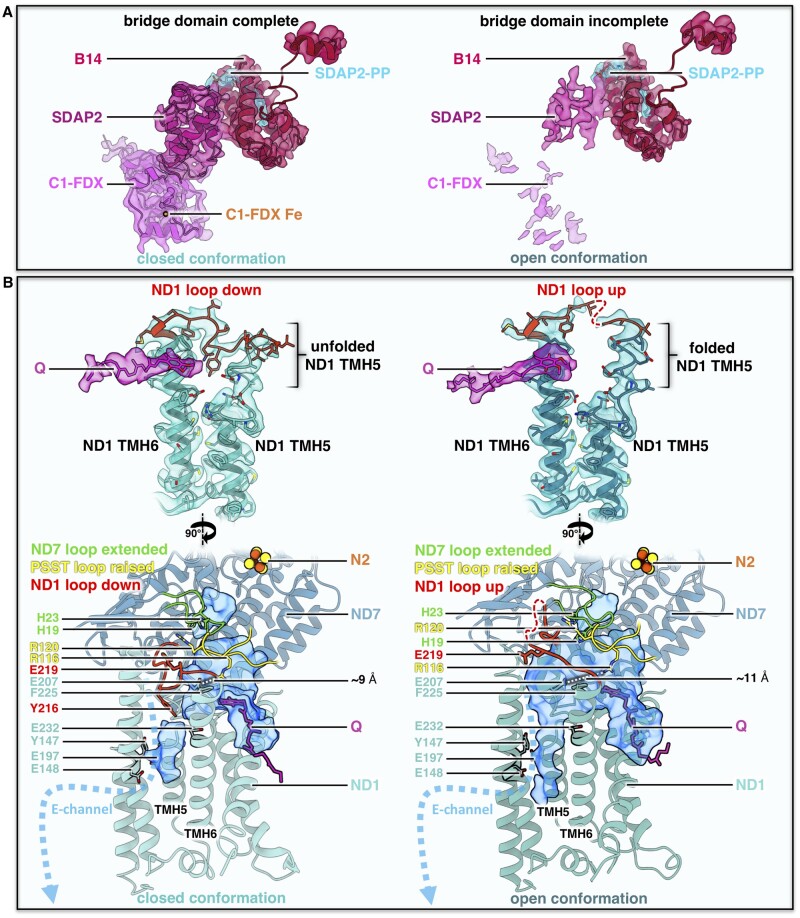
Figure 6.
Bridge domain and conformations of the Q binding site in the open and closed form of Arabidopsis complex I (CI). A, Map density and fitted atomic models of the bridge domain in Arabidopsis. Subunits color scheme as in Figures 1 and 2. B, Conformation of the Q binding site in the open and closed complex I conformations. Top: orientation of the loop (red) between TMH5 and TMH6 in ND1. Below: Q binding channel (blue) with E-channel on the left, showing the different conformations of ND1 together with the loop of ND7 (green, 49 kDa subunit in mammals) and PSST (yellow). Conserved amino acids drawn as sticks. Distances between ND1_E207 and PSST_R116 are indicated as dashed lines. For details, see Supplemental Figure S23.

