Figure 2.
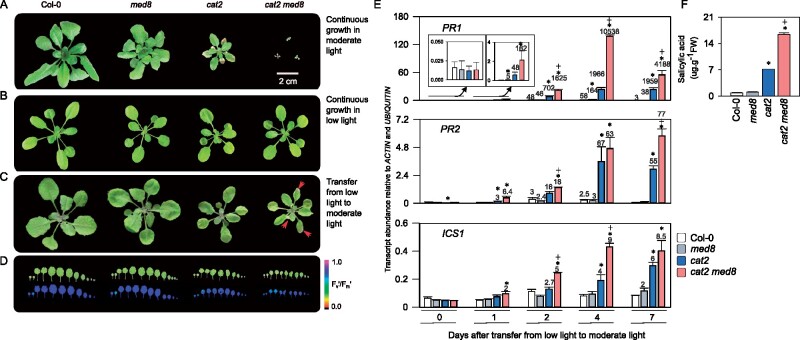
The med8 mutation promotes H2O2-dependent cell death and associated response in long days. A and B, Representative photographs of 3-week-old plants grown under moderate (200 µmol· m−2·s−1) and low light (50 µmol·m−2·s−1) in a long-day photoperiod (16-h light/8-h dark), respectively. C, Phenotypes induced by the onset of oxidative stress. Plants were grown under low light (50 µmol·m−2·s−1) for 18 days and then transferred to moderate light irradiance (200 µmol·m−2·s−1) to induce oxidative stress in the cat2 backgrounds. Photographs were taken 4 days after transfer. Arrows indicate foliar lesion formation. D, Leaf series (top) and corresponding Fv′/Fm′ (bottom) from a representative rosette taken 4 days after transfer. Whole-plant leaf series from representative rosettes are displayed to highlight the occurrence of cell death on older leaves. Leaf sets are preceded by two cotyledons, with leaf 1 at the third position from the left. E, SA-related gene expression in Col-0, med8, cat2, and cat2 med8 plants under the conditions described in (C). ICS1, PR1, and PR2 transcript levels were quantified by RT-qPCR, relative to ACTIN and UBIQUITIN, in plants transferred from low-to-moderate light at the indicated days. Values are means ± SE of biological triplicates. Numbers above the bars indicate fold-change relative to control conditions (Day 0) in the respective genotypes. Only fold-change values higher than 2 are displayed. Significant differences are *P ≤0.05 (comparison between mutants and Col-0) and +P ≤0.05 (comparison between double mutants and cat2; Student’s t test). F, Total SA levels were determined 7 days after transfer from low-to-moderate light. Values are means ± SE of three biological repeats. Significant differences are *P ≤0.05 (comparison between mutants and Col-0) and +P ≤0.05 (comparison between double mutants and cat2; Student’s t test).

