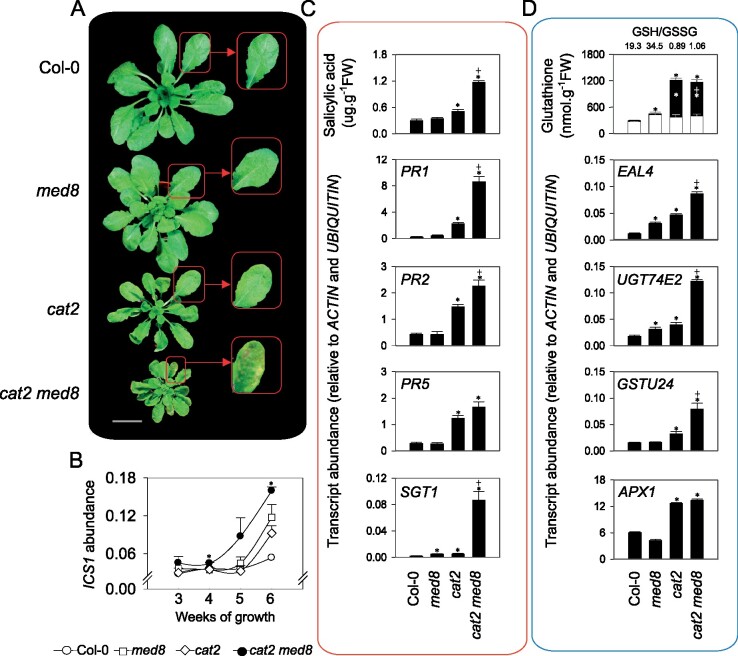
Figure 3.
The med8 mutation activates the H2O2-dependent cell death response in nonpermissive short-day conditions. A, Representative pictures of 5-week-old plants grown under moderate light (200 µmol·m−2·s−1) in a short-day photoperiod (8-h light/16-h dark). Red arrows indicate lesion formation on the double mutant leaves. Bar = 2 cm. B, Time course analysis of ICS1 expression. ICS1 transcripts were quantified in short-day grown plants at the indicated weeks. C, SA levels and related gene expression in Col-0, cat2, med8, and cat2 med8 plants grown in short days for 6 weeks. The PR1, PR2, PR5, and SGT1 transcripts were quantified by RT-qPCR, relative to ACTIN and UBIQUITIN. D, Glutathione and redox marker transcript levels in Col-0, cat2, med8, and cat2 med8 plants grown in short days for 6 weeks. In the top graph (glutathione), white and black bars correspond to reduced glutathione (GSH) and oxidized glutathione (GSSG), respectively. Numbers above the bars indicate GSH/GSSG ratios. In (B), (C), and (D), values are means ± SE of three biological repeats. Significant differences are *P ≤0.05 (comparison between mutants and Col-0) and +P ≤0.05 (comparison between double mutants and cat2; Student’s t test).

