Figure 5.
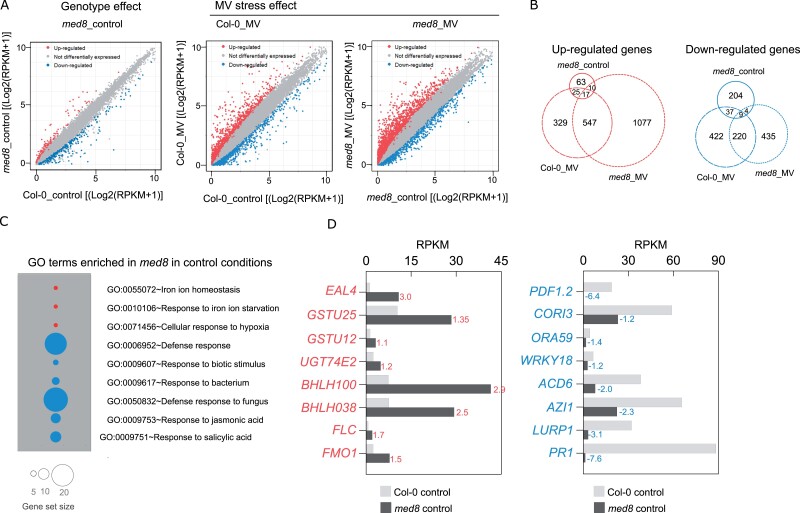
Overview of changes in the med8 transcriptome under control and MV-induced oxidative stress. A, Scatter plot visualization of expression levels of all transcripts analyzed in RNA-seq showing med8_control versus Col-0_control (left), Col-0_MV versus Col-0_control (middle), and med8_MV versus med8_control (right). Differentially expressed genes (absolute value of log2FC>1, FDR<0.01) are indicated by red (upregulated) or blue (downregulated). ctrl, control. B, Venn diagrams for comparison of differentially expressed genes shown in (A). Red and blue circles refer to upregulated and downregulated genes, respectively. C, Gene ontology enrichment analysis in med8 control conditions. Red and blue circles indicate gene sets that are upregulated or downregulated, respectively. D, Examples of genes induced or repressed in med8 under control conditions. Numbers next to each bar indicate log2FC (med8_control versus Col-0_control).

