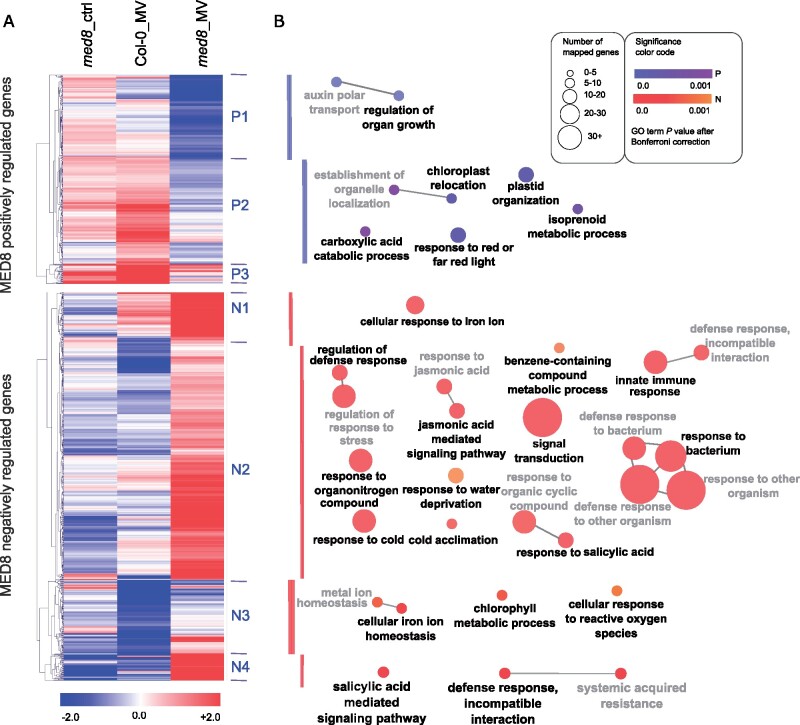
Figure 6.
Transcriptomic signature of med8 in response to MV-induced oxidative stress. A, Heat map visualizing the expression of 1,184 genes that are either positively (P) or negatively (N) regulated by MED8 under MV stress based on two-way ANOVA analysis (Supplemental Data Set 5). Hierarchical clustering with tMEV identified seven main clusters. Expression is given as Log2FC. From left to right: med8_control versus Col-0_control, Col-0_MV versus Col-0_control, and med8_MV versus med8_control. B, GO term enrichment analysis for each cluster displayed in (A) by ClueGo 2.5. The size of the nodes reflects the number of genes in each GO term, and the fill color intensity reflects the corresponding P value for enrichment after Bonferroni correction. GO terms were grouped based on their similarity (edge thickness represents the kappa score of similarity between two GO terms), and the most significant terms in each group are shown in bold.

