Figure 3.
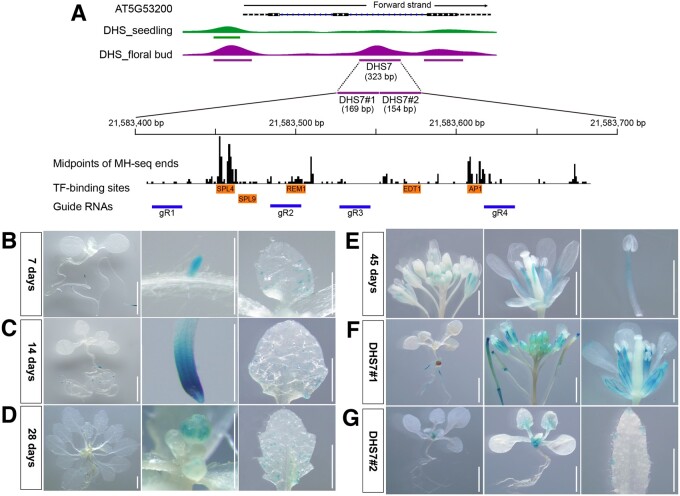
Validation of the DHS7 enhancer using transgenic assays. A, Integrative Genomics Viewer (IGV) tracks of TRY (AT5G53200) and its associated DHSs. DHS7 (323 bp) was identified in the flower data set and is located in the second intron. The DHS7 region is expanded to show the sequence positions of DHS7#1 (169 bp) and DHS7#2 (154 bp), and the locations of midpoints of all sequence reads derived from MNase hypersensitivity sequencing (MH-seq). The positions of binding motifs of five TFs and the four guide RNAs used for CRISPR/Cas editing are also marked. B, GUS expression of 7-d-old transgenic plants derived from DHS7. GUS expression was observed in the main root tips, emerging lateral root tips, and in the incipient trichome at the base of first rosette leaf. C, GUS expression of 14-d-old transgenic plants derived from DHS7. GUS signals were detected in root tips and the trichome-forming zone of young leaves. D, GUS expression of 28-d-old transgenic plants derived from DHS7. GUS signals were detectable in the flower buds as well as in the root tip and the trichome-forming zone of young leaves. E, GUS expression of 45-d-old transgenic plants derived from DHS7. Robust GUS signals were detected in the stamen filaments and faintly in the petals. F, Representative GUS expression patterns in transgenic plants derived from DHS7#1. GUS signals were faintly expressed in roots and robustly expressed in stamen filaments and sepals. G, Representative GUS expression pattern of transgenic plants derived from DHS7#2. GUS activity was detected in roots, rosette, and cauline leaves. All white bars represent 2 mm.

