
Figure 7.
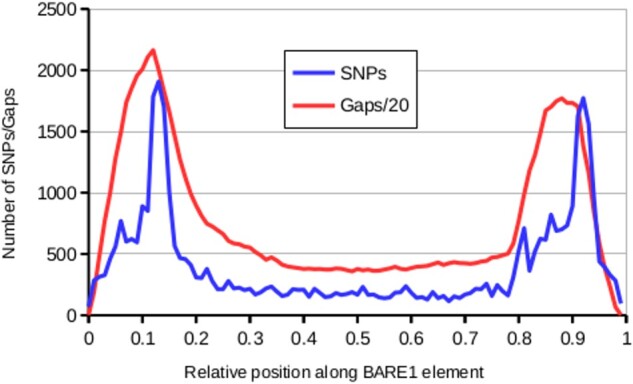
Distribution of sequence gaps and sequence differences in BARE1 elements between Morex V1 and V3. The graph is a compilation of results from sequence alignments of 3,305 v1 and v3 full-length BARE1 retrotransposons. As individual retrotransposon copies can differ in length, the length was normalized to 1,000 bins. The plot shows numbers of SNPs and numbers of N’s in 10-bin windows. The LTRs correspond to approximately the first and last 20% of the retrotransposon. These regions are highly enriched in SNPs and sequence gaps because of the inability of short-read assemblies to resolve highly similar regions longer than a few hundred base pair.