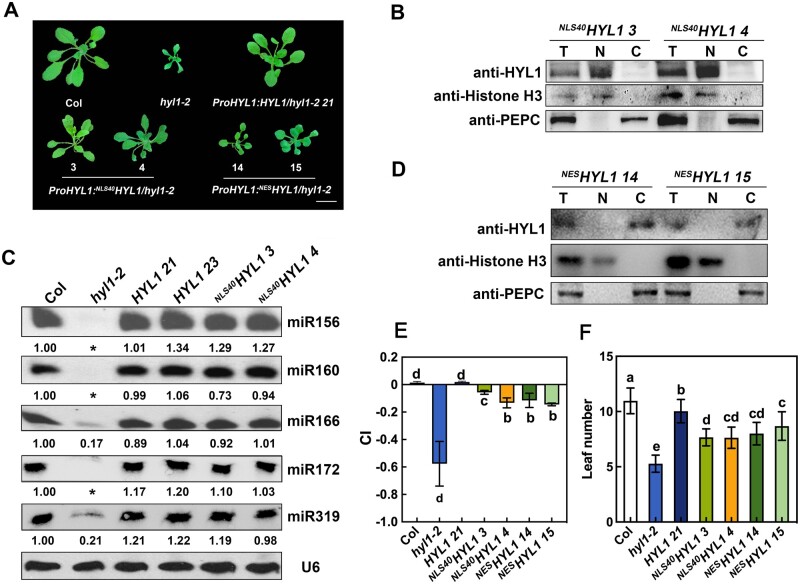
Figure 2.
Both nuclear and cytoplasmic HYL1 partially rescue the hyl1-2 phenotype. A, Phenotypes of transgenic plants expressing different HYL1 constructs at the rosette stage. Arabic numbers represent different transgenic lines. Scale bar, 1 cm. B, Immunoblot analysis to detect HYL1 protein in the nuclear and cytoplasmic fractions from the seedling of NLS40HYL1 transgenic plants. T, N, and C represent total, nuclear, and cytoplasmic aliquots, respectively. C, Northern blotting showing the accumulation of miRNAs in WT, hyl1-2, HYL1, and NLS40HYL1 transgenic plants. Asterisks repredcsents no band was observed. D, Immunoblotting to detect HYL1 protein in the nuclear and cytoplasmic fractions from the seedling of NESHYL1 transgenic plants. E, Quantification (Mean ± SD) showing the leaf CI of transgenic plants expressing different HYL1 constructs. The sixth rosette leaves of 4-week-old WT and transgenic plants were selected for CI measurement. n = 20. F, Quantification (mean ± SD) showing the leaf number of WT and different transgenic plants. n > 15. Statistically significant differences between groups were indicated by different letters. ANOVA, P < 0.05.

