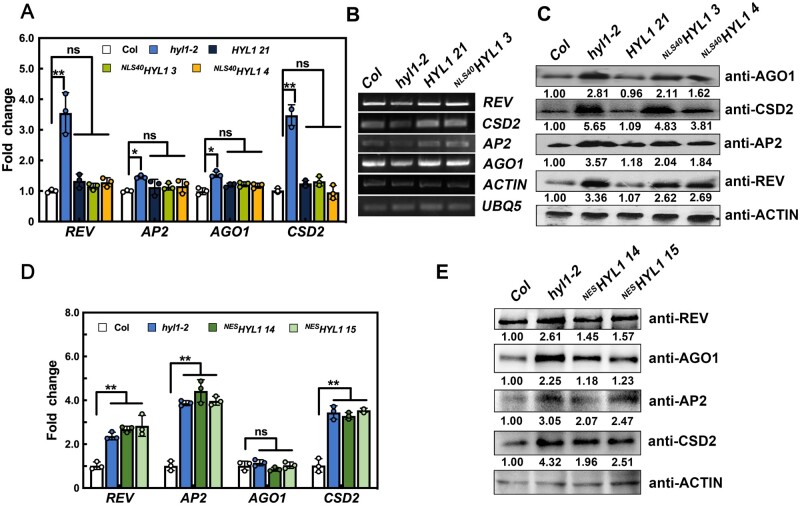
Figure 4.
Translational inhibition of miRNA-targeted genes by cytoplasmic HYL1. A, The relative expression levels of miRNA-targeted mRNAs in WT, hyl1-2, HYL1, and NLS40HYL1 transgenic plants. B, 5′ RACE RT-PCR showing the accumulation of the 3′ fragments generated by miRNA-guided cleavage of target mRNAs. UBQ5 and ACTIN were used as loading controls. C, Immunoblotting showing the levels of target proteins in WT, hyl1-2, HYL1, and NLS40HYL1 transgenic plants. D, The relative expression levels of miRNA-targeted mRNAs in WT, hyl1-2, and NESHYL1 transgenic plants. E, Immunoblotting showing the levels of target proteins in WT, hyl1-2, and NESHYL1 transgenic plants. P-values were calculated with a two-tailed Student’s t test, *P < 0.05, **P < 0.01. ns, no significance. Quantification of the RT-qPCR is presented as Mean ± SD.

