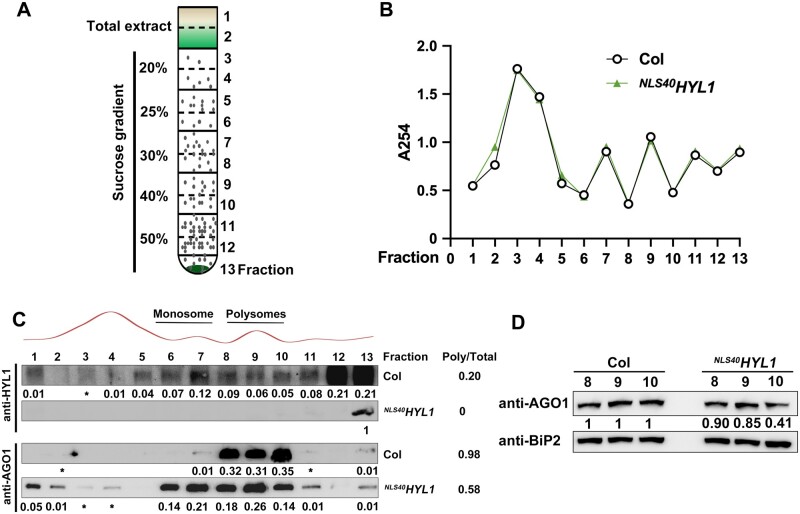
Figure 7.
Effect of cytoplasmic HYL1 on the enrichment of AGO1 in polysomes. A, A diagram showing the sucrose gradients used for the isolation of polysomes from wild-type and NLS40HYL1 plants. Sucrose gradients from 50% to 20% were injected into the tubes, and 13 fractions were collected for further analysis. B, The A254 absorption profiles of the 13 sucrose gradient fractions. C, Immunoblotting showing the accumulation of HYL1 and AGO1 proteins in the 13 sucrose gradient fractions. * indicates the intensity of the band is ˂0.01 compared to total abundance. D, Immunoblotting showing the accumulation of AGO1 proteins in fractions 8, 9, and 10 of sucrose gradients.

